Native/Alaskan vs Mongolian Professional Degree
COMPARE
Native/Alaskan
Mongolian
Professional Degree
Professional Degree Comparison
Natives/Alaskans
Mongolians
3.0%
PROFESSIONAL DEGREE
0.0/ 100
METRIC RATING
335th/ 347
METRIC RANK
6.1%
PROFESSIONAL DEGREE
100.0/ 100
METRIC RATING
34th/ 347
METRIC RANK
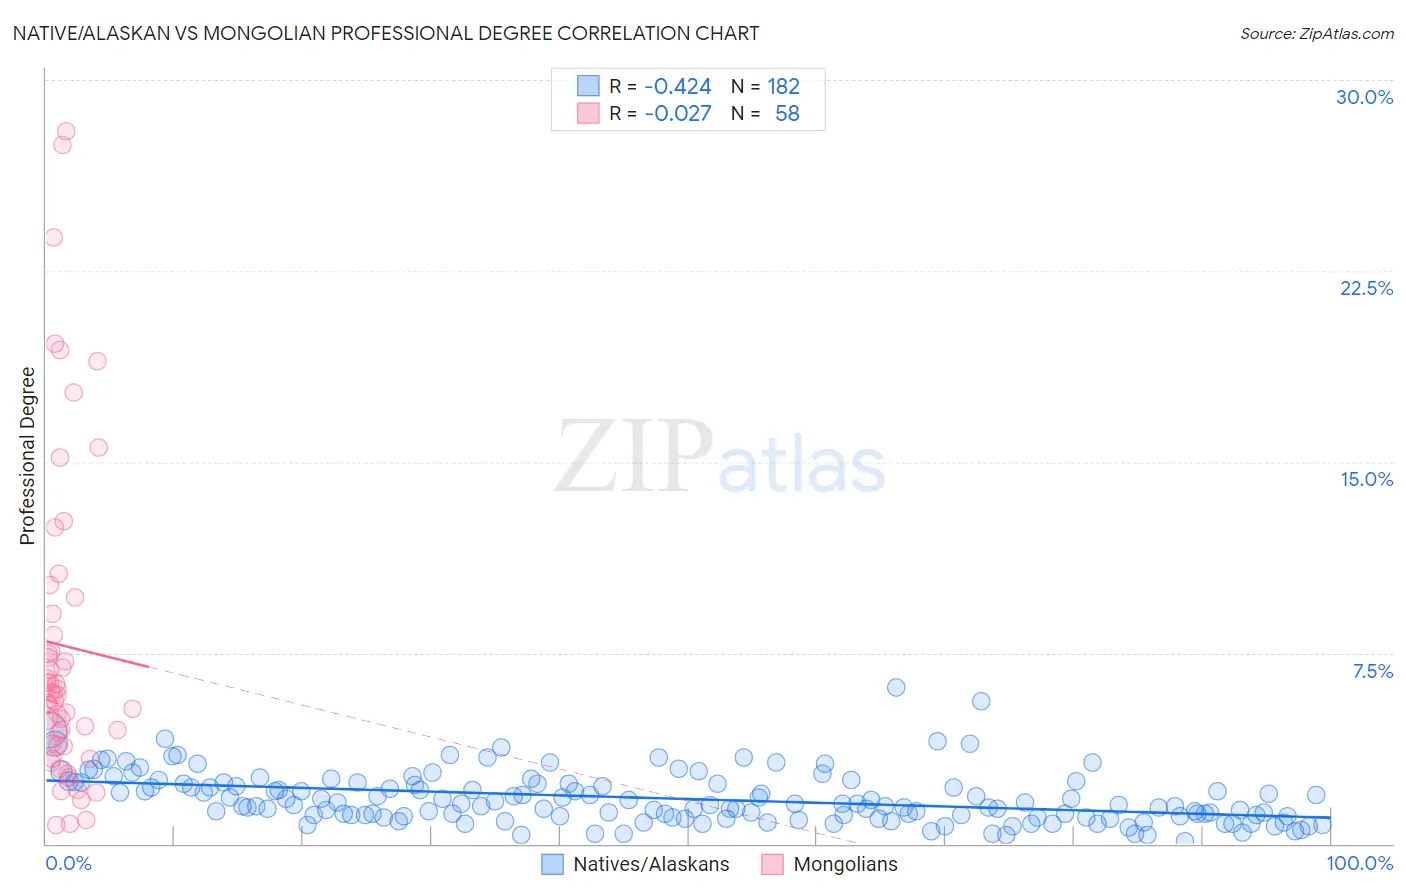
Native/Alaskan vs Mongolian Professional Degree Correlation Chart
The statistical analysis conducted on geographies consisting of 508,142,680 people shows a moderate negative correlation between the proportion of Natives/Alaskans and percentage of population with at least professional degree education in the United States with a correlation coefficient (R) of -0.424 and weighted average of 3.0%. Similarly, the statistical analysis conducted on geographies consisting of 140,296,057 people shows no correlation between the proportion of Mongolians and percentage of population with at least professional degree education in the United States with a correlation coefficient (R) of -0.027 and weighted average of 6.1%, a difference of 107.6%.
Professional Degree Correlation Summary
| Measurement | Native/Alaskan | Mongolian |
| Minimum | 0.12% | 0.72% |
| Maximum | 6.1% | 28.0% |
| Range | 6.0% | 27.3% |
| Mean | 1.8% | 7.8% |
| Median | 1.5% | 5.9% |
| Interquartile 25% (IQ1) | 1.1% | 3.9% |
| Interquartile 75% (IQ3) | 2.3% | 9.0% |
| Interquartile Range (IQR) | 1.3% | 5.1% |
| Standard Deviation (Sample) | 1.0% | 6.4% |
| Standard Deviation (Population) | 1.0% | 6.3% |
Similar Demographics by Professional Degree
Demographics Similar to Natives/Alaskans by Professional Degree
In terms of professional degree, the demographic groups most similar to Natives/Alaskans are Pennsylvania German (3.0%, a difference of 0.56%), Fijian (2.9%, a difference of 1.0%), Arapaho (2.9%, a difference of 2.8%), Navajo (2.9%, a difference of 2.9%), and Immigrants from Central America (2.9%, a difference of 3.0%).
| Demographics | Rating | Rank | Professional Degree |
| Creek | 0.0 /100 | #328 | Tragic 3.1% |
| Bangladeshis | 0.0 /100 | #329 | Tragic 3.1% |
| Immigrants | Cabo Verde | 0.0 /100 | #330 | Tragic 3.1% |
| Kiowa | 0.0 /100 | #331 | Tragic 3.1% |
| Yakama | 0.0 /100 | #332 | Tragic 3.1% |
| Puget Sound Salish | 0.0 /100 | #333 | Tragic 3.1% |
| Pennsylvania Germans | 0.0 /100 | #334 | Tragic 3.0% |
| Natives/Alaskans | 0.0 /100 | #335 | Tragic 3.0% |
| Fijians | 0.0 /100 | #336 | Tragic 2.9% |
| Arapaho | 0.0 /100 | #337 | Tragic 2.9% |
| Navajo | 0.0 /100 | #338 | Tragic 2.9% |
| Immigrants | Central America | 0.0 /100 | #339 | Tragic 2.9% |
| Yup'ik | 0.0 /100 | #340 | Tragic 2.9% |
| Tohono O'odham | 0.0 /100 | #341 | Tragic 2.8% |
| Immigrants | Azores | 0.0 /100 | #342 | Tragic 2.8% |
Demographics Similar to Mongolians by Professional Degree
In terms of professional degree, the demographic groups most similar to Mongolians are Burmese (6.1%, a difference of 0.13%), Thai (6.1%, a difference of 0.17%), Immigrants from India (6.2%, a difference of 0.40%), Immigrants from Sri Lanka (6.2%, a difference of 0.52%), and Immigrants from Turkey (6.2%, a difference of 0.52%).
| Demographics | Rating | Rank | Professional Degree |
| Immigrants | Northern Europe | 100.0 /100 | #27 | Exceptional 6.2% |
| Turks | 100.0 /100 | #28 | Exceptional 6.2% |
| Immigrants | Sri Lanka | 100.0 /100 | #29 | Exceptional 6.2% |
| Immigrants | Turkey | 100.0 /100 | #30 | Exceptional 6.2% |
| Immigrants | India | 100.0 /100 | #31 | Exceptional 6.2% |
| Thais | 100.0 /100 | #32 | Exceptional 6.1% |
| Burmese | 100.0 /100 | #33 | Exceptional 6.1% |
| Mongolians | 100.0 /100 | #34 | Exceptional 6.1% |
| Immigrants | Korea | 100.0 /100 | #35 | Exceptional 6.1% |
| Immigrants | Russia | 100.0 /100 | #36 | Exceptional 6.0% |
| Immigrants | Austria | 100.0 /100 | #37 | Exceptional 6.0% |
| Immigrants | Norway | 100.0 /100 | #38 | Exceptional 6.0% |
| Immigrants | South Africa | 100.0 /100 | #39 | Exceptional 6.0% |
| Cambodians | 100.0 /100 | #40 | Exceptional 6.0% |
| New Zealanders | 100.0 /100 | #41 | Exceptional 6.0% |