Hispanic or Latino vs Menominee Disability Age 18 to 34
COMPARE
Hispanic or Latino
Menominee
Disability Age 18 to 34
Disability Age 18 to 34 Comparison
Hispanics or Latinos
Menominee
6.8%
DISABILITY AGE 18 TO 34
13.8/ 100
METRIC RATING
203rd/ 347
METRIC RANK
7.8%
DISABILITY AGE 18 TO 34
0.0/ 100
METRIC RATING
305th/ 347
METRIC RANK
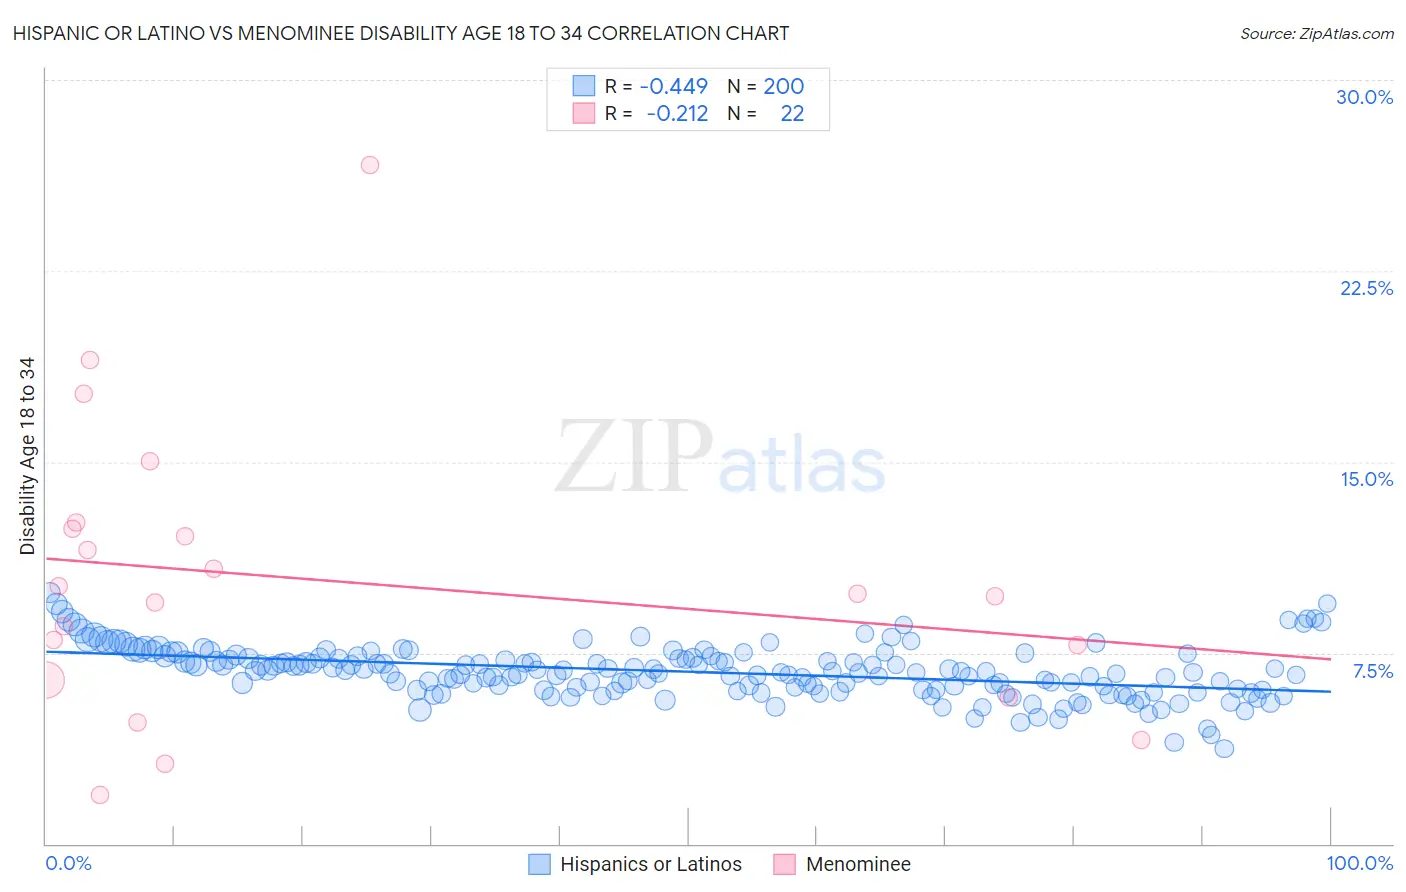
Hispanic or Latino vs Menominee Disability Age 18 to 34 Correlation Chart
The statistical analysis conducted on geographies consisting of 571,884,699 people shows a moderate negative correlation between the proportion of Hispanics or Latinos and percentage of population with a disability between the ages 18 and 35 in the United States with a correlation coefficient (R) of -0.449 and weighted average of 6.8%. Similarly, the statistical analysis conducted on geographies consisting of 45,742,015 people shows a weak negative correlation between the proportion of Menominee and percentage of population with a disability between the ages 18 and 35 in the United States with a correlation coefficient (R) of -0.212 and weighted average of 7.8%, a difference of 14.3%.
Disability Age 18 to 34 Correlation Summary
| Measurement | Hispanic or Latino | Menominee |
| Minimum | 3.7% | 1.9% |
| Maximum | 9.9% | 26.7% |
| Range | 6.1% | 24.8% |
| Mean | 6.8% | 10.3% |
| Median | 6.8% | 9.8% |
| Interquartile 25% (IQ1) | 6.1% | 6.4% |
| Interquartile 75% (IQ3) | 7.3% | 12.4% |
| Interquartile Range (IQR) | 1.3% | 6.0% |
| Standard Deviation (Sample) | 1.0% | 5.7% |
| Standard Deviation (Population) | 1.0% | 5.5% |
Similar Demographics by Disability Age 18 to 34
Demographics Similar to Hispanics or Latinos by Disability Age 18 to 34
In terms of disability age 18 to 34, the demographic groups most similar to Hispanics or Latinos are Immigrants from Bosnia and Herzegovina (6.8%, a difference of 0.020%), Lebanese (6.8%, a difference of 0.080%), Japanese (6.8%, a difference of 0.15%), Mexican (6.8%, a difference of 0.18%), and Immigrants from Scotland (6.8%, a difference of 0.21%).
| Demographics | Rating | Rank | Disability Age 18 to 34 |
| Immigrants | Netherlands | 21.0 /100 | #196 | Fair 6.7% |
| Estonians | 20.6 /100 | #197 | Fair 6.8% |
| Australians | 19.4 /100 | #198 | Poor 6.8% |
| Kenyans | 18.3 /100 | #199 | Poor 6.8% |
| Sierra Leoneans | 17.5 /100 | #200 | Poor 6.8% |
| Greeks | 16.1 /100 | #201 | Poor 6.8% |
| Panamanians | 15.8 /100 | #202 | Poor 6.8% |
| Hispanics or Latinos | 13.8 /100 | #203 | Poor 6.8% |
| Immigrants | Bosnia and Herzegovina | 13.6 /100 | #204 | Poor 6.8% |
| Lebanese | 13.3 /100 | #205 | Poor 6.8% |
| Japanese | 12.8 /100 | #206 | Poor 6.8% |
| Mexicans | 12.6 /100 | #207 | Poor 6.8% |
| Immigrants | Scotland | 12.4 /100 | #208 | Poor 6.8% |
| Immigrants | Burma/Myanmar | 12.3 /100 | #209 | Poor 6.8% |
| Latvians | 11.1 /100 | #210 | Poor 6.8% |
Demographics Similar to Menominee by Disability Age 18 to 34
In terms of disability age 18 to 34, the demographic groups most similar to Menominee are Shoshone (7.8%, a difference of 0.080%), English (7.8%, a difference of 0.080%), Scotch-Irish (7.8%, a difference of 0.34%), Pennsylvania German (7.8%, a difference of 0.37%), and Alaska Native (7.8%, a difference of 0.38%).
| Demographics | Rating | Rank | Disability Age 18 to 34 |
| Dutch | 0.0 /100 | #298 | Tragic 7.7% |
| Germans | 0.0 /100 | #299 | Tragic 7.7% |
| Scottish | 0.0 /100 | #300 | Tragic 7.7% |
| Pima | 0.0 /100 | #301 | Tragic 7.7% |
| Welsh | 0.0 /100 | #302 | Tragic 7.7% |
| Cheyenne | 0.0 /100 | #303 | Tragic 7.7% |
| Shoshone | 0.0 /100 | #304 | Tragic 7.8% |
| Menominee | 0.0 /100 | #305 | Tragic 7.8% |
| English | 0.0 /100 | #306 | Tragic 7.8% |
| Scotch-Irish | 0.0 /100 | #307 | Tragic 7.8% |
| Pennsylvania Germans | 0.0 /100 | #308 | Tragic 7.8% |
| Alaska Natives | 0.0 /100 | #309 | Tragic 7.8% |
| Finns | 0.0 /100 | #310 | Tragic 7.8% |
| French | 0.0 /100 | #311 | Tragic 7.9% |
| Spanish Americans | 0.0 /100 | #312 | Tragic 7.9% |