Immigrants from Morocco vs Macedonian Disability Age 18 to 34
COMPARE
Immigrants from Morocco
Macedonian
Disability Age 18 to 34
Disability Age 18 to 34 Comparison
Immigrants from Morocco
Macedonians
6.3%
DISABILITY AGE 18 TO 34
92.9/ 100
METRIC RATING
124th/ 347
METRIC RANK
6.3%
DISABILITY AGE 18 TO 34
92.6/ 100
METRIC RATING
125th/ 347
METRIC RANK
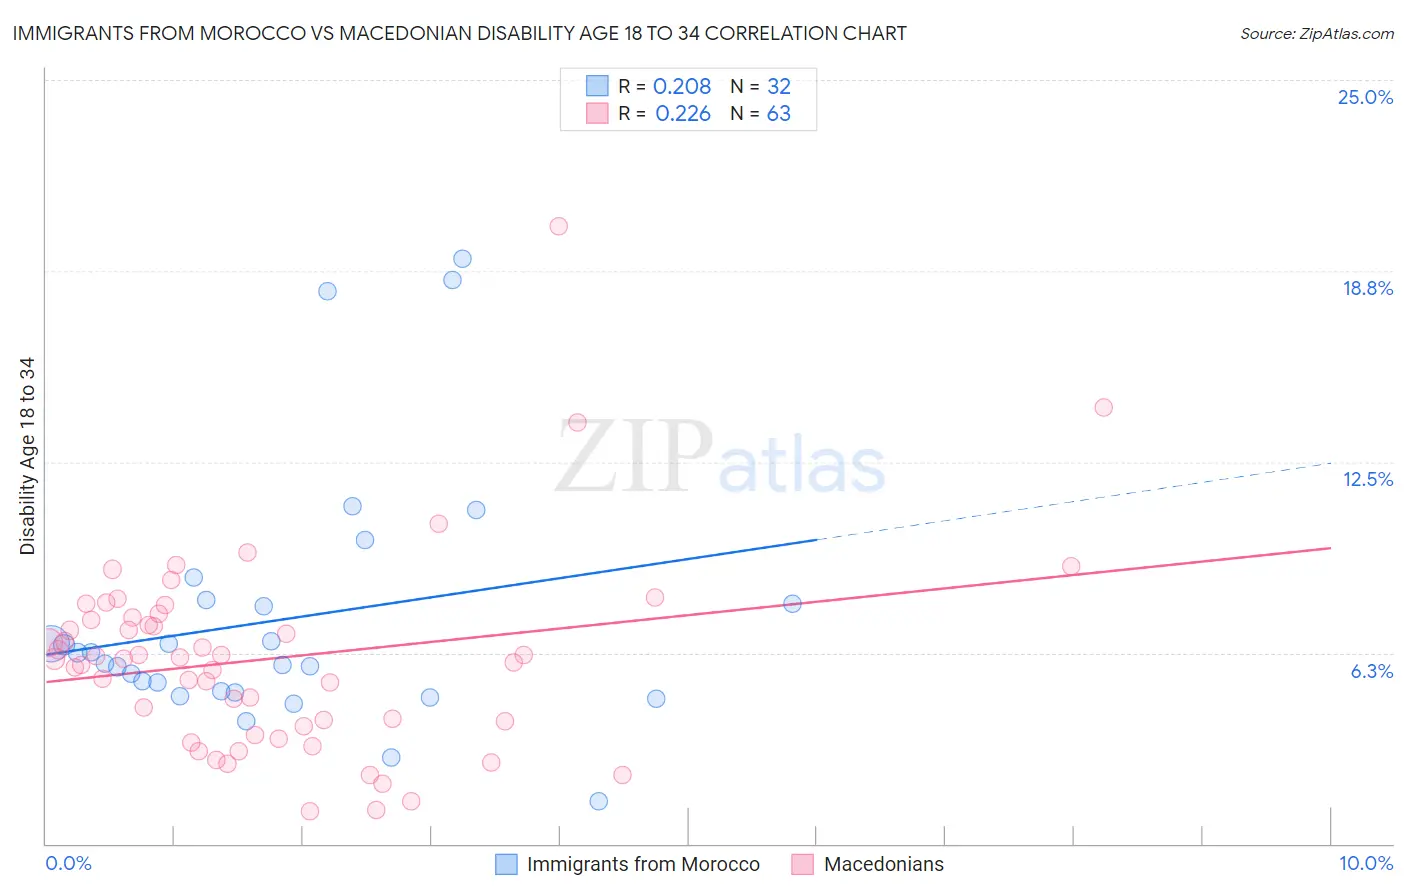
Immigrants from Morocco vs Macedonian Disability Age 18 to 34 Correlation Chart
The statistical analysis conducted on geographies consisting of 178,772,233 people shows a weak positive correlation between the proportion of Immigrants from Morocco and percentage of population with a disability between the ages 18 and 35 in the United States with a correlation coefficient (R) of 0.208 and weighted average of 6.3%. Similarly, the statistical analysis conducted on geographies consisting of 132,591,648 people shows a weak positive correlation between the proportion of Macedonians and percentage of population with a disability between the ages 18 and 35 in the United States with a correlation coefficient (R) of 0.226 and weighted average of 6.3%, a difference of 0.070%.
Disability Age 18 to 34 Correlation Summary
| Measurement | Immigrants from Morocco | Macedonian |
| Minimum | 1.4% | 1.1% |
| Maximum | 19.2% | 20.2% |
| Range | 17.7% | 19.2% |
| Mean | 7.4% | 6.1% |
| Median | 6.1% | 6.1% |
| Interquartile 25% (IQ1) | 5.0% | 3.8% |
| Interquartile 75% (IQ3) | 7.9% | 7.4% |
| Interquartile Range (IQR) | 2.9% | 3.6% |
| Standard Deviation (Sample) | 4.2% | 3.2% |
| Standard Deviation (Population) | 4.1% | 3.2% |
Demographics Similar to Immigrants from Morocco and Macedonians by Disability Age 18 to 34
In terms of disability age 18 to 34, the demographic groups most similar to Immigrants from Morocco are Costa Rican (6.3%, a difference of 0.020%), Immigrants from Switzerland (6.3%, a difference of 0.10%), Immigrants from Czechoslovakia (6.3%, a difference of 0.12%), Immigrants from Guatemala (6.3%, a difference of 0.14%), and Immigrants from Ukraine (6.3%, a difference of 0.15%). Similarly, the demographic groups most similar to Macedonians are Immigrants from Switzerland (6.3%, a difference of 0.030%), Costa Rican (6.3%, a difference of 0.080%), West Indian (6.3%, a difference of 0.16%), Chinese (6.3%, a difference of 0.18%), and Immigrants from Czechoslovakia (6.3%, a difference of 0.19%).
| Demographics | Rating | Rank | Disability Age 18 to 34 |
| Immigrants | South Eastern Asia | 94.4 /100 | #114 | Exceptional 6.3% |
| Koreans | 94.1 /100 | #115 | Exceptional 6.3% |
| Immigrants | Costa Rica | 94.0 /100 | #116 | Exceptional 6.3% |
| Immigrants | Jordan | 94.0 /100 | #117 | Exceptional 6.3% |
| Immigrants | Nepal | 93.7 /100 | #118 | Exceptional 6.3% |
| Chileans | 93.5 /100 | #119 | Exceptional 6.3% |
| Immigrants | Ukraine | 93.4 /100 | #120 | Exceptional 6.3% |
| Immigrants | Guatemala | 93.4 /100 | #121 | Exceptional 6.3% |
| Immigrants | Czechoslovakia | 93.3 /100 | #122 | Exceptional 6.3% |
| Costa Ricans | 92.9 /100 | #123 | Exceptional 6.3% |
| Immigrants | Morocco | 92.9 /100 | #124 | Exceptional 6.3% |
| Macedonians | 92.6 /100 | #125 | Exceptional 6.3% |
| Immigrants | Switzerland | 92.5 /100 | #126 | Exceptional 6.3% |
| West Indians | 92.0 /100 | #127 | Exceptional 6.3% |
| Chinese | 91.9 /100 | #128 | Exceptional 6.3% |
| Immigrants | Italy | 90.5 /100 | #129 | Exceptional 6.3% |
| Immigrants | Dominica | 90.5 /100 | #130 | Exceptional 6.3% |
| Immigrants | Saudi Arabia | 90.4 /100 | #131 | Exceptional 6.3% |
| Guatemalans | 89.6 /100 | #132 | Excellent 6.4% |
| Brazilians | 89.0 /100 | #133 | Excellent 6.4% |
| Immigrants | Europe | 88.8 /100 | #134 | Excellent 6.4% |