Native/Alaskan vs Croatian Family Households
COMPARE
Native/Alaskan
Croatian
Family Households
Family Households Comparison
Natives/Alaskans
Croatians
66.4%
FAMILY HOUSEHOLDS
100.0/ 100
METRIC RATING
51st/ 347
METRIC RANK
63.8%
FAMILY HOUSEHOLDS
7.3/ 100
METRIC RATING
216th/ 347
METRIC RANK
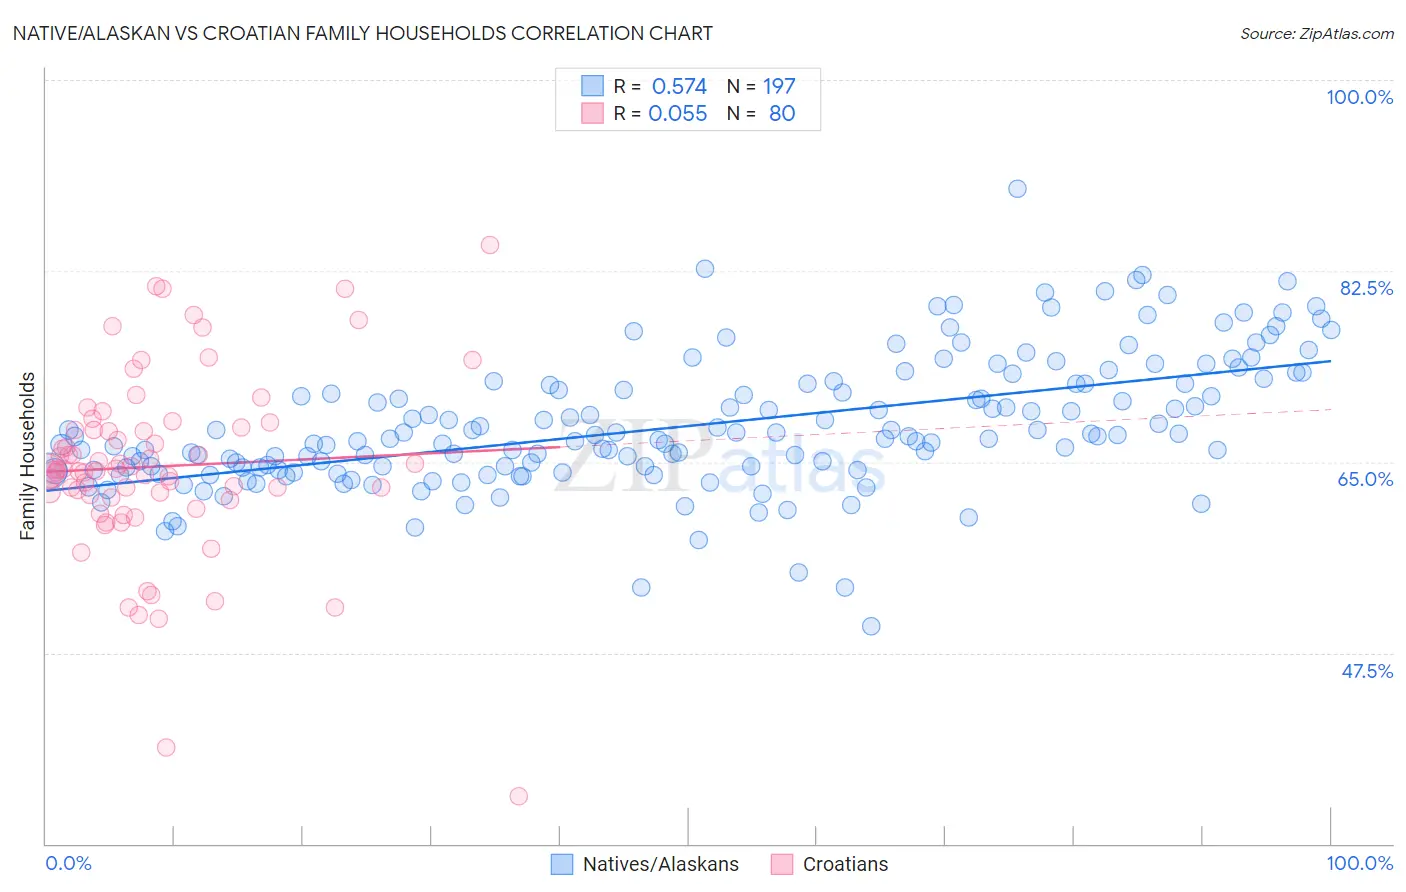
Native/Alaskan vs Croatian Family Households Correlation Chart
The statistical analysis conducted on geographies consisting of 512,654,863 people shows a substantial positive correlation between the proportion of Natives/Alaskans and percentage of family households in the United States with a correlation coefficient (R) of 0.574 and weighted average of 66.4%. Similarly, the statistical analysis conducted on geographies consisting of 375,542,706 people shows a slight positive correlation between the proportion of Croatians and percentage of family households in the United States with a correlation coefficient (R) of 0.055 and weighted average of 63.8%, a difference of 4.1%.
Family Households Correlation Summary
| Measurement | Native/Alaskan | Croatian |
| Minimum | 49.9% | 34.4% |
| Maximum | 90.0% | 84.8% |
| Range | 40.1% | 50.4% |
| Mean | 68.3% | 64.6% |
| Median | 67.2% | 64.2% |
| Interquartile 25% (IQ1) | 64.2% | 61.9% |
| Interquartile 75% (IQ3) | 72.1% | 68.1% |
| Interquartile Range (IQR) | 7.9% | 6.2% |
| Standard Deviation (Sample) | 6.0% | 8.4% |
| Standard Deviation (Population) | 6.0% | 8.4% |
Similar Demographics by Family Households
Demographics Similar to Natives/Alaskans by Family Households
In terms of family households, the demographic groups most similar to Natives/Alaskans are Navajo (66.4%, a difference of 0.030%), Immigrants from South Central Asia (66.4%, a difference of 0.090%), Immigrants from Venezuela (66.4%, a difference of 0.14%), Colombian (66.3%, a difference of 0.14%), and Afghan (66.3%, a difference of 0.14%).
| Demographics | Rating | Rank | Family Households |
| Asians | 100.0 /100 | #44 | Exceptional 66.5% |
| Venezuelans | 100.0 /100 | #45 | Exceptional 66.5% |
| Arapaho | 100.0 /100 | #46 | Exceptional 66.5% |
| Bolivians | 100.0 /100 | #47 | Exceptional 66.5% |
| Immigrants | Venezuela | 100.0 /100 | #48 | Exceptional 66.4% |
| Immigrants | South Central Asia | 100.0 /100 | #49 | Exceptional 66.4% |
| Navajo | 100.0 /100 | #50 | Exceptional 66.4% |
| Natives/Alaskans | 100.0 /100 | #51 | Exceptional 66.4% |
| Colombians | 100.0 /100 | #52 | Exceptional 66.3% |
| Afghans | 100.0 /100 | #53 | Exceptional 66.3% |
| Immigrants | Colombia | 100.0 /100 | #54 | Exceptional 66.3% |
| Immigrants | Immigrants | 100.0 /100 | #55 | Exceptional 66.1% |
| Immigrants | Hong Kong | 100.0 /100 | #56 | Exceptional 66.1% |
| Pennsylvania Germans | 100.0 /100 | #57 | Exceptional 66.1% |
| Immigrants | Asia | 100.0 /100 | #58 | Exceptional 66.1% |
Demographics Similar to Croatians by Family Households
In terms of family households, the demographic groups most similar to Croatians are Osage (63.7%, a difference of 0.010%), Belgian (63.8%, a difference of 0.020%), Marshallese (63.7%, a difference of 0.020%), Celtic (63.8%, a difference of 0.030%), and Macedonian (63.7%, a difference of 0.040%).
| Demographics | Rating | Rank | Family Households |
| Sierra Leoneans | 11.2 /100 | #209 | Poor 63.9% |
| Immigrants | Thailand | 9.6 /100 | #210 | Tragic 63.8% |
| Shoshone | 9.4 /100 | #211 | Tragic 63.8% |
| Immigrants | Netherlands | 9.4 /100 | #212 | Tragic 63.8% |
| Immigrants | Northern Europe | 8.8 /100 | #213 | Tragic 63.8% |
| Celtics | 8.0 /100 | #214 | Tragic 63.8% |
| Belgians | 7.6 /100 | #215 | Tragic 63.8% |
| Croatians | 7.3 /100 | #216 | Tragic 63.8% |
| Osage | 7.0 /100 | #217 | Tragic 63.7% |
| Marshallese | 6.9 /100 | #218 | Tragic 63.7% |
| Macedonians | 6.5 /100 | #219 | Tragic 63.7% |
| Immigrants | Europe | 6.4 /100 | #220 | Tragic 63.7% |
| Immigrants | South Africa | 5.9 /100 | #221 | Tragic 63.7% |
| Immigrants | Belarus | 5.5 /100 | #222 | Tragic 63.7% |
| French Canadians | 5.4 /100 | #223 | Tragic 63.7% |