Carpatho Rusyn vs Croatian Disability Age 65 to 74
COMPARE
Carpatho Rusyn
Croatian
Disability Age 65 to 74
Disability Age 65 to 74 Comparison
Carpatho Rusyns
Croatians
21.6%
DISABILITY AGE 65 TO 74
99.5/ 100
METRIC RATING
62nd/ 347
METRIC RANK
21.8%
DISABILITY AGE 65 TO 74
98.9/ 100
METRIC RATING
81st/ 347
METRIC RANK
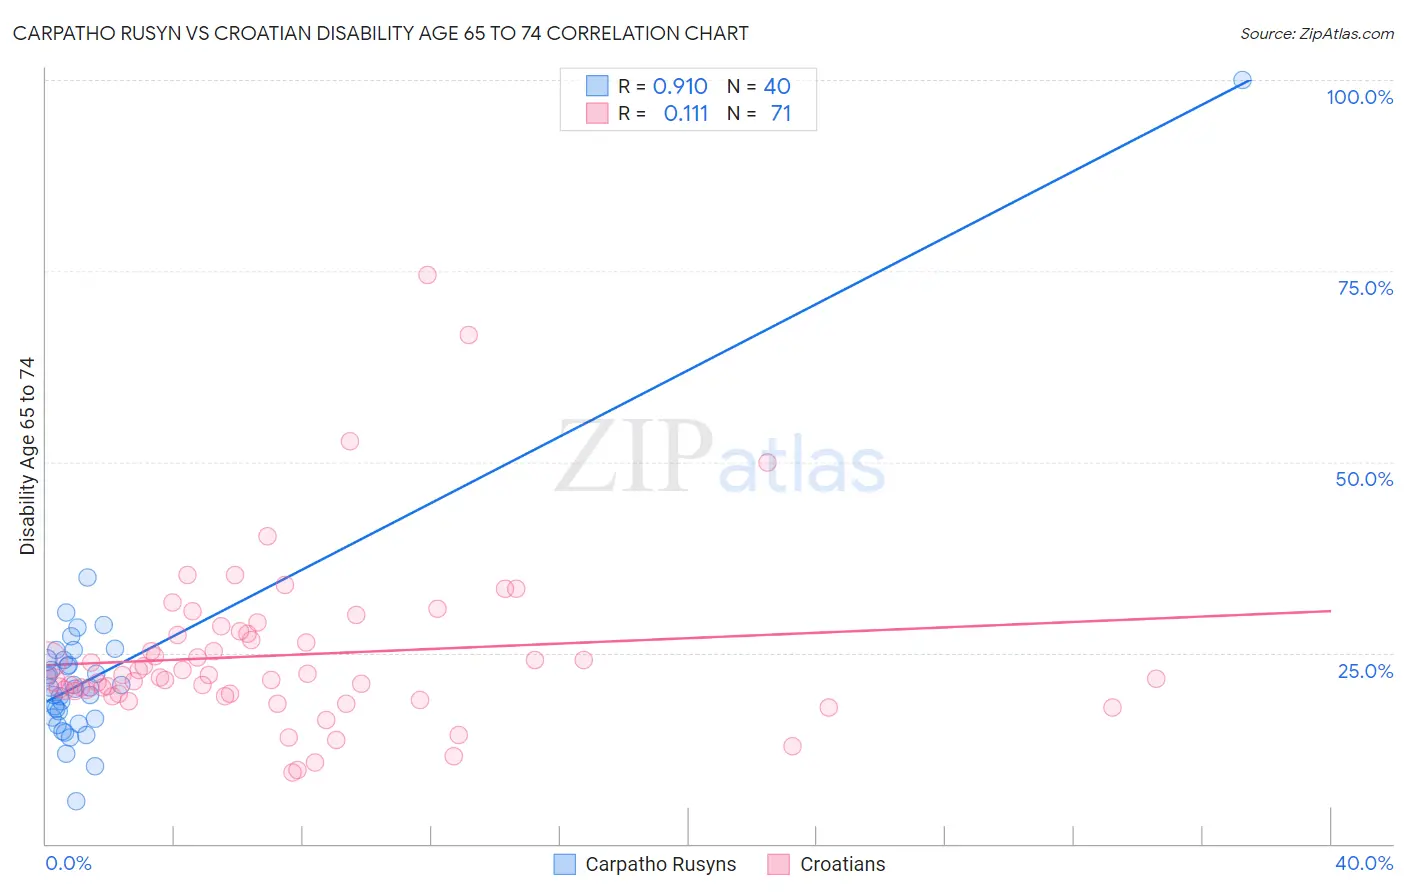
Carpatho Rusyn vs Croatian Disability Age 65 to 74 Correlation Chart
The statistical analysis conducted on geographies consisting of 58,867,646 people shows a near-perfect positive correlation between the proportion of Carpatho Rusyns and percentage of population with a disability between the ages 65 and 75 in the United States with a correlation coefficient (R) of 0.910 and weighted average of 21.6%. Similarly, the statistical analysis conducted on geographies consisting of 375,202,419 people shows a poor positive correlation between the proportion of Croatians and percentage of population with a disability between the ages 65 and 75 in the United States with a correlation coefficient (R) of 0.111 and weighted average of 21.8%, a difference of 1.1%.
Disability Age 65 to 74 Correlation Summary
| Measurement | Carpatho Rusyn | Croatian |
| Minimum | 5.6% | 9.4% |
| Maximum | 100.0% | 74.4% |
| Range | 94.4% | 65.1% |
| Mean | 22.3% | 24.7% |
| Median | 20.5% | 21.8% |
| Interquartile 25% (IQ1) | 16.5% | 19.6% |
| Interquartile 75% (IQ3) | 24.0% | 27.4% |
| Interquartile Range (IQR) | 7.6% | 7.8% |
| Standard Deviation (Sample) | 13.8% | 11.1% |
| Standard Deviation (Population) | 13.7% | 11.0% |
Demographics Similar to Carpatho Rusyns and Croatians by Disability Age 65 to 74
In terms of disability age 65 to 74, the demographic groups most similar to Carpatho Rusyns are Egyptian (21.6%, a difference of 0.030%), Immigrants from Europe (21.6%, a difference of 0.10%), Immigrants from Latvia (21.6%, a difference of 0.18%), Immigrants from Russia (21.6%, a difference of 0.19%), and Maltese (21.6%, a difference of 0.20%). Similarly, the demographic groups most similar to Croatians are Immigrants from Norway (21.8%, a difference of 0.070%), Immigrants from Eastern Europe (21.8%, a difference of 0.080%), Venezuelan (21.8%, a difference of 0.080%), Immigrants from Poland (21.8%, a difference of 0.14%), and Greek (21.8%, a difference of 0.20%).
| Demographics | Rating | Rank | Disability Age 65 to 74 |
| Egyptians | 99.5 /100 | #61 | Exceptional 21.6% |
| Carpatho Rusyns | 99.5 /100 | #62 | Exceptional 21.6% |
| Immigrants | Europe | 99.4 /100 | #63 | Exceptional 21.6% |
| Immigrants | Latvia | 99.4 /100 | #64 | Exceptional 21.6% |
| Immigrants | Russia | 99.4 /100 | #65 | Exceptional 21.6% |
| Maltese | 99.4 /100 | #66 | Exceptional 21.6% |
| Immigrants | South Africa | 99.3 /100 | #67 | Exceptional 21.7% |
| Immigrants | Scotland | 99.3 /100 | #68 | Exceptional 21.7% |
| Immigrants | Egypt | 99.2 /100 | #69 | Exceptional 21.7% |
| Chinese | 99.2 /100 | #70 | Exceptional 21.7% |
| Immigrants | Belarus | 99.2 /100 | #71 | Exceptional 21.7% |
| Immigrants | Hungary | 99.2 /100 | #72 | Exceptional 21.7% |
| Immigrants | Venezuela | 99.0 /100 | #73 | Exceptional 21.8% |
| Cambodians | 99.0 /100 | #74 | Exceptional 21.8% |
| Mongolians | 99.0 /100 | #75 | Exceptional 21.8% |
| Greeks | 99.0 /100 | #76 | Exceptional 21.8% |
| Immigrants | Poland | 99.0 /100 | #77 | Exceptional 21.8% |
| Immigrants | Eastern Europe | 99.0 /100 | #78 | Exceptional 21.8% |
| Venezuelans | 99.0 /100 | #79 | Exceptional 21.8% |
| Immigrants | Norway | 98.9 /100 | #80 | Exceptional 21.8% |
| Croatians | 98.9 /100 | #81 | Exceptional 21.8% |