Immigrants from Belize vs Basque Disability Age 65 to 74
COMPARE
Immigrants from Belize
Basque
Disability Age 65 to 74
Disability Age 65 to 74 Comparison
Immigrants from Belize
Basques
25.8%
DISABILITY AGE 65 TO 74
0.1/ 100
METRIC RATING
278th/ 347
METRIC RANK
23.5%
DISABILITY AGE 65 TO 74
38.4/ 100
METRIC RATING
186th/ 347
METRIC RANK
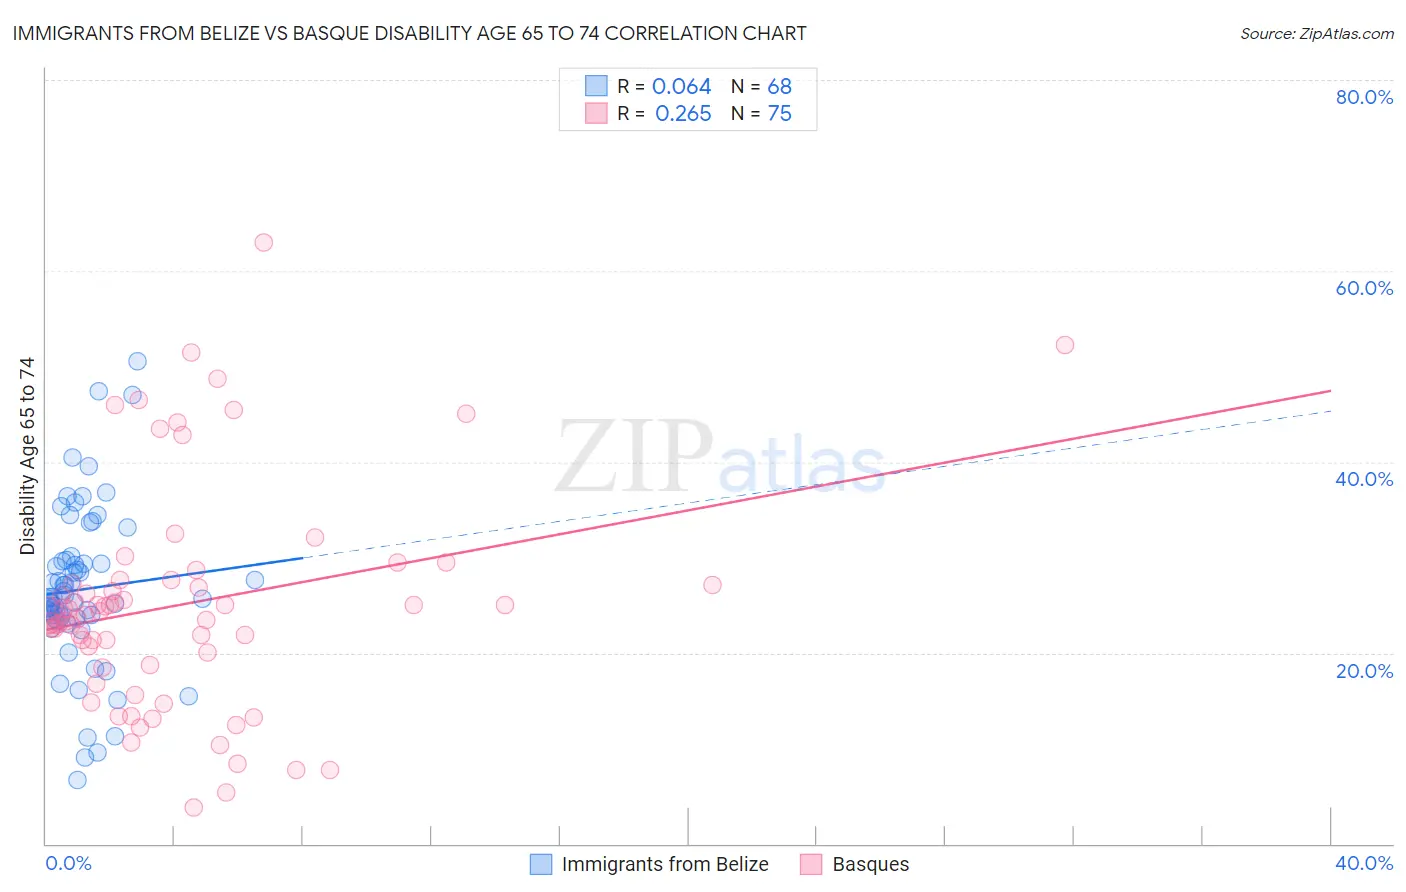
Immigrants from Belize vs Basque Disability Age 65 to 74 Correlation Chart
The statistical analysis conducted on geographies consisting of 130,230,175 people shows a slight positive correlation between the proportion of Immigrants from Belize and percentage of population with a disability between the ages 65 and 75 in the United States with a correlation coefficient (R) of 0.064 and weighted average of 25.8%. Similarly, the statistical analysis conducted on geographies consisting of 165,654,682 people shows a weak positive correlation between the proportion of Basques and percentage of population with a disability between the ages 65 and 75 in the United States with a correlation coefficient (R) of 0.265 and weighted average of 23.5%, a difference of 10.0%.
Disability Age 65 to 74 Correlation Summary
| Measurement | Immigrants from Belize | Basque |
| Minimum | 6.7% | 3.8% |
| Maximum | 50.6% | 63.0% |
| Range | 43.9% | 59.1% |
| Mean | 26.6% | 25.1% |
| Median | 25.8% | 24.0% |
| Interquartile 25% (IQ1) | 23.6% | 18.7% |
| Interquartile 75% (IQ3) | 29.7% | 27.6% |
| Interquartile Range (IQR) | 6.1% | 8.8% |
| Standard Deviation (Sample) | 8.5% | 11.6% |
| Standard Deviation (Population) | 8.4% | 11.6% |
Similar Demographics by Disability Age 65 to 74
Demographics Similar to Immigrants from Belize by Disability Age 65 to 74
In terms of disability age 65 to 74, the demographic groups most similar to Immigrants from Belize are Belizean (25.8%, a difference of 0.020%), U.S. Virgin Islander (25.9%, a difference of 0.080%), French American Indian (25.8%, a difference of 0.11%), American (25.8%, a difference of 0.13%), and Honduran (25.8%, a difference of 0.13%).
| Demographics | Rating | Rank | Disability Age 65 to 74 |
| Immigrants | Liberia | 0.1 /100 | #271 | Tragic 25.7% |
| Immigrants | Dominica | 0.1 /100 | #272 | Tragic 25.7% |
| Japanese | 0.1 /100 | #273 | Tragic 25.7% |
| Americans | 0.1 /100 | #274 | Tragic 25.8% |
| Hondurans | 0.1 /100 | #275 | Tragic 25.8% |
| French American Indians | 0.1 /100 | #276 | Tragic 25.8% |
| Belizeans | 0.1 /100 | #277 | Tragic 25.8% |
| Immigrants | Belize | 0.1 /100 | #278 | Tragic 25.8% |
| U.S. Virgin Islanders | 0.1 /100 | #279 | Tragic 25.9% |
| Cree | 0.1 /100 | #280 | Tragic 25.9% |
| Immigrants | Honduras | 0.1 /100 | #281 | Tragic 25.9% |
| Delaware | 0.1 /100 | #282 | Tragic 25.9% |
| Spanish Americans | 0.0 /100 | #283 | Tragic 25.9% |
| Immigrants | Azores | 0.0 /100 | #284 | Tragic 26.0% |
| Immigrants | Congo | 0.0 /100 | #285 | Tragic 26.0% |
Demographics Similar to Basques by Disability Age 65 to 74
In terms of disability age 65 to 74, the demographic groups most similar to Basques are Portuguese (23.5%, a difference of 0.040%), Haitian (23.4%, a difference of 0.24%), Immigrants from Germany (23.4%, a difference of 0.25%), Immigrants from Eastern Africa (23.4%, a difference of 0.27%), and Immigrants from Cuba (23.6%, a difference of 0.27%).
| Demographics | Rating | Rank | Disability Age 65 to 74 |
| Immigrants | Sierra Leone | 45.8 /100 | #179 | Average 23.4% |
| Scandinavians | 45.6 /100 | #180 | Average 23.4% |
| Assyrians/Chaldeans/Syriacs | 45.3 /100 | #181 | Average 23.4% |
| Irish | 44.4 /100 | #182 | Average 23.4% |
| Immigrants | Eastern Africa | 42.8 /100 | #183 | Average 23.4% |
| Immigrants | Germany | 42.5 /100 | #184 | Average 23.4% |
| Haitians | 42.4 /100 | #185 | Average 23.4% |
| Basques | 38.4 /100 | #186 | Fair 23.5% |
| Portuguese | 37.8 /100 | #187 | Fair 23.5% |
| Immigrants | Cuba | 34.0 /100 | #188 | Fair 23.6% |
| Scottish | 33.1 /100 | #189 | Fair 23.6% |
| Immigrants | Guyana | 31.2 /100 | #190 | Fair 23.6% |
| Immigrants | Bangladesh | 30.2 /100 | #191 | Fair 23.6% |
| Ecuadorians | 29.7 /100 | #192 | Fair 23.6% |
| English | 28.5 /100 | #193 | Fair 23.6% |