Alsatian vs Bahamian Disability Age 35 to 64
COMPARE
Alsatian
Bahamian
Disability Age 35 to 64
Disability Age 35 to 64 Comparison
Alsatians
Bahamians
11.8%
DISABILITY AGE 35 TO 64
8.5/ 100
METRIC RATING
221st/ 347
METRIC RANK
11.8%
DISABILITY AGE 35 TO 64
10.7/ 100
METRIC RATING
216th/ 347
METRIC RANK
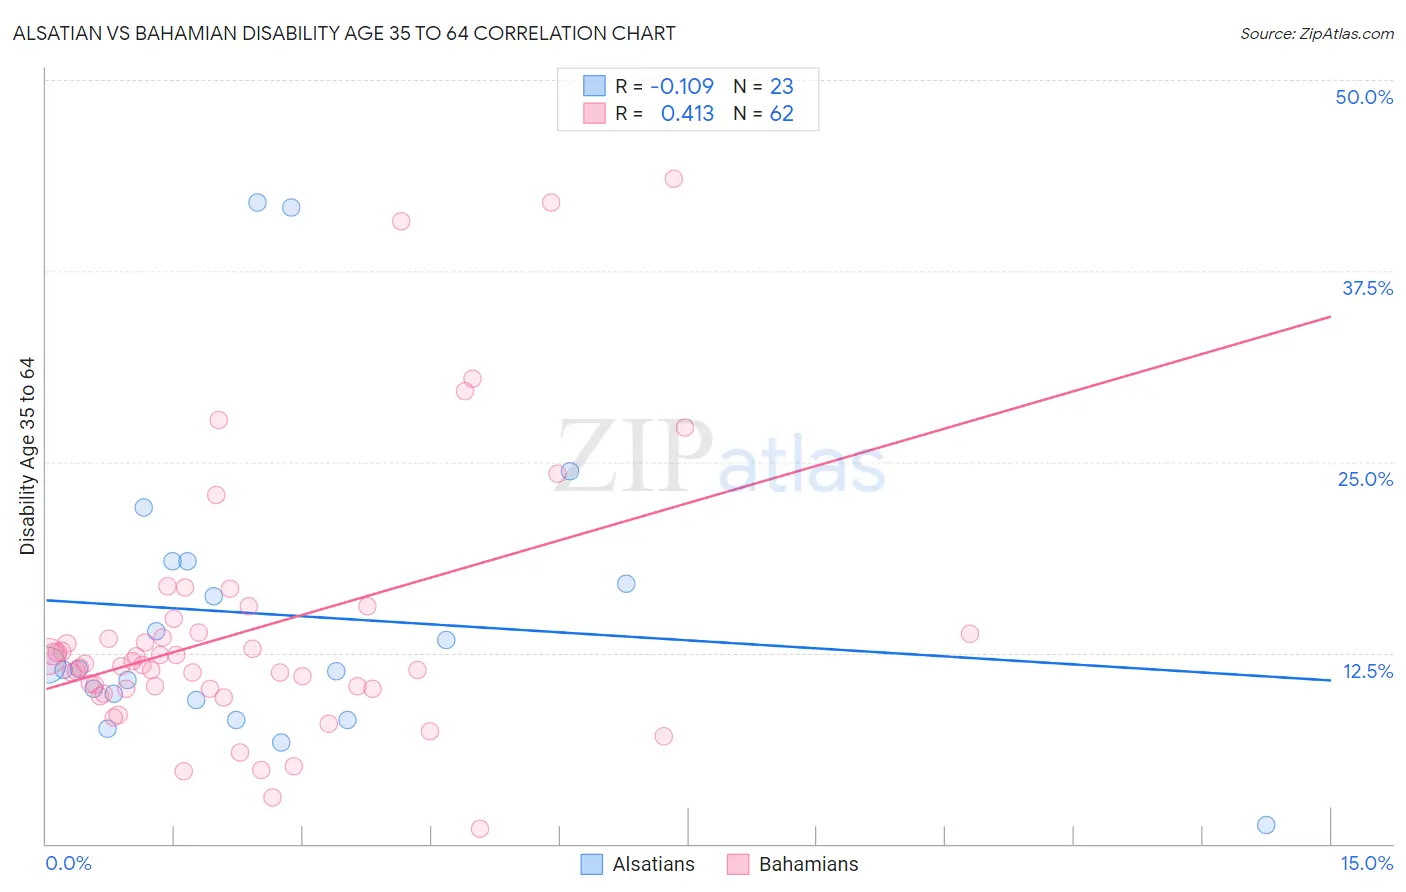
Alsatian vs Bahamian Disability Age 35 to 64 Correlation Chart
The statistical analysis conducted on geographies consisting of 82,678,494 people shows a poor negative correlation between the proportion of Alsatians and percentage of population with a disability between the ages 34 and 64 in the United States with a correlation coefficient (R) of -0.109 and weighted average of 11.8%. Similarly, the statistical analysis conducted on geographies consisting of 112,619,678 people shows a moderate positive correlation between the proportion of Bahamians and percentage of population with a disability between the ages 34 and 64 in the United States with a correlation coefficient (R) of 0.413 and weighted average of 11.8%, a difference of 0.49%.
Disability Age 35 to 64 Correlation Summary
| Measurement | Alsatian | Bahamian |
| Minimum | 1.2% | 0.98% |
| Maximum | 42.0% | 43.5% |
| Range | 40.8% | 42.6% |
| Mean | 15.0% | 14.0% |
| Median | 11.4% | 11.8% |
| Interquartile 25% (IQ1) | 9.4% | 10.1% |
| Interquartile 75% (IQ3) | 18.5% | 13.8% |
| Interquartile Range (IQR) | 9.1% | 3.7% |
| Standard Deviation (Sample) | 9.9% | 8.6% |
| Standard Deviation (Population) | 9.7% | 8.5% |
Demographics Similar to Alsatians and Bahamians by Disability Age 35 to 64
In terms of disability age 35 to 64, the demographic groups most similar to Alsatians are Honduran (11.8%, a difference of 0.020%), Immigrants from Honduras (11.8%, a difference of 0.020%), Immigrants from West Indies (11.8%, a difference of 0.090%), Czechoslovakian (11.8%, a difference of 0.13%), and Immigrants from Ghana (11.8%, a difference of 0.17%). Similarly, the demographic groups most similar to Bahamians are Spanish American Indian (11.7%, a difference of 0.090%), Immigrants from Sudan (11.7%, a difference of 0.14%), Yugoslavian (11.7%, a difference of 0.18%), Immigrants from Jamaica (11.7%, a difference of 0.21%), and Barbadian (11.8%, a difference of 0.26%).
| Demographics | Rating | Rank | Disability Age 35 to 64 |
| Guatemalans | 14.6 /100 | #208 | Poor 11.7% |
| Europeans | 13.5 /100 | #209 | Poor 11.7% |
| Belgians | 13.1 /100 | #210 | Poor 11.7% |
| Canadians | 13.0 /100 | #211 | Poor 11.7% |
| Immigrants | Jamaica | 11.8 /100 | #212 | Poor 11.7% |
| Yugoslavians | 11.6 /100 | #213 | Poor 11.7% |
| Immigrants | Sudan | 11.4 /100 | #214 | Poor 11.7% |
| Spanish American Indians | 11.1 /100 | #215 | Poor 11.7% |
| Bahamians | 10.7 /100 | #216 | Poor 11.8% |
| Barbadians | 9.5 /100 | #217 | Tragic 11.8% |
| Immigrants | Bahamas | 9.2 /100 | #218 | Tragic 11.8% |
| Czechoslovakians | 9.0 /100 | #219 | Tragic 11.8% |
| Immigrants | West Indies | 8.9 /100 | #220 | Tragic 11.8% |
| Alsatians | 8.5 /100 | #221 | Tragic 11.8% |
| Hondurans | 8.4 /100 | #222 | Tragic 11.8% |
| Immigrants | Honduras | 8.4 /100 | #223 | Tragic 11.8% |
| Immigrants | Ghana | 7.8 /100 | #224 | Tragic 11.8% |
| Immigrants | Belize | 6.6 /100 | #225 | Tragic 11.9% |
| Scandinavians | 6.4 /100 | #226 | Tragic 11.9% |
| Immigrants | Central America | 6.3 /100 | #227 | Tragic 11.9% |
| Immigrants | Germany | 6.2 /100 | #228 | Tragic 11.9% |