Native Hawaiian vs Immigrants from Senegal Self-Care Disability
COMPARE
Native Hawaiian
Immigrants from Senegal
Self-Care Disability
Self-Care Disability Comparison
Native Hawaiians
Immigrants from Senegal
2.6%
SELF-CARE DISABILITY
5.1/ 100
METRIC RATING
211th/ 347
METRIC RANK
2.6%
SELF-CARE DISABILITY
1.6/ 100
METRIC RATING
237th/ 347
METRIC RANK
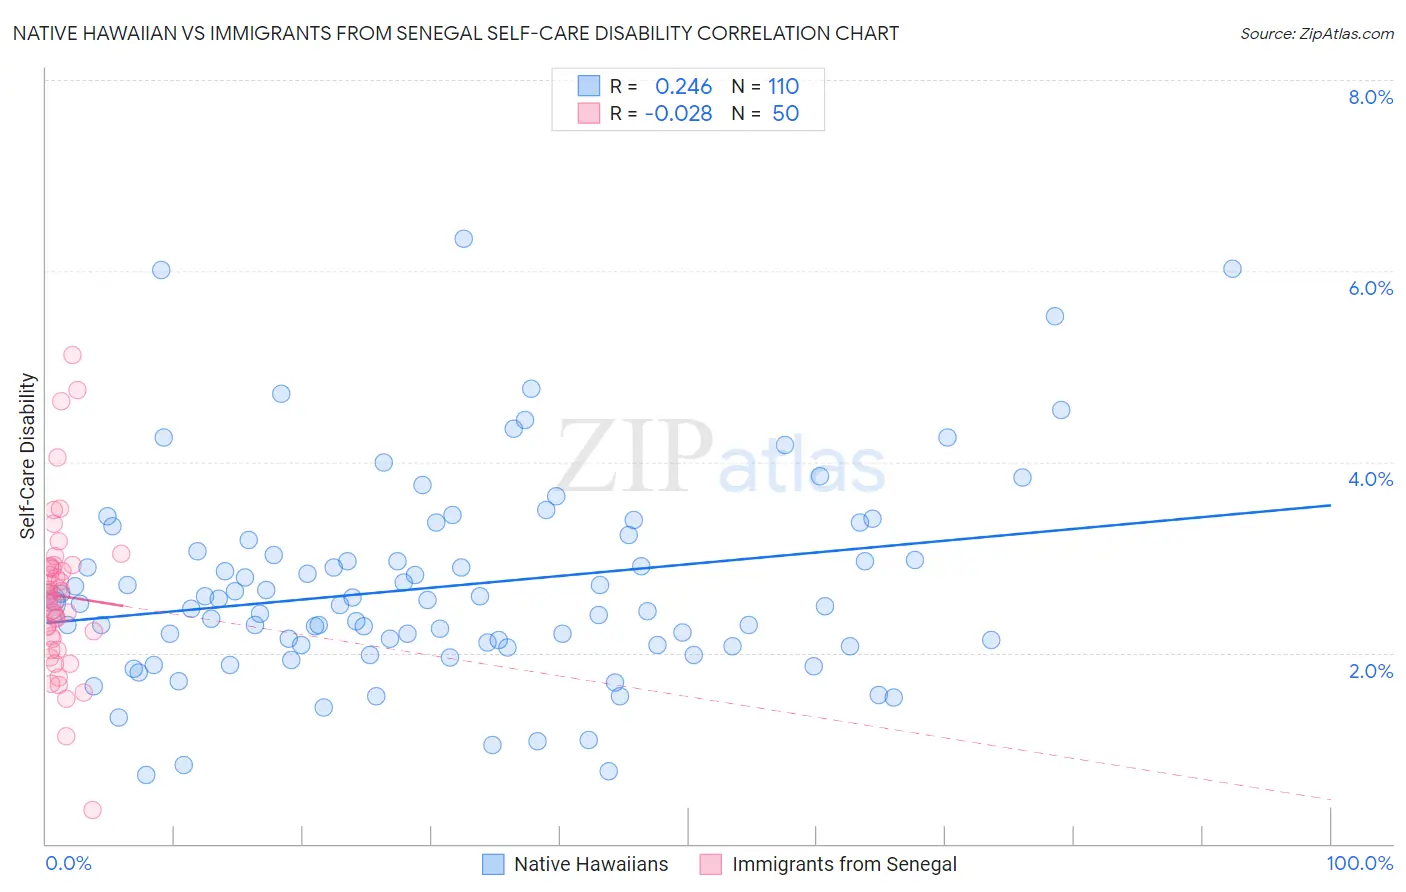
Native Hawaiian vs Immigrants from Senegal Self-Care Disability Correlation Chart
The statistical analysis conducted on geographies consisting of 331,613,173 people shows a weak positive correlation between the proportion of Native Hawaiians and percentage of population with self-care disability in the United States with a correlation coefficient (R) of 0.246 and weighted average of 2.6%. Similarly, the statistical analysis conducted on geographies consisting of 90,114,981 people shows no correlation between the proportion of Immigrants from Senegal and percentage of population with self-care disability in the United States with a correlation coefficient (R) of -0.028 and weighted average of 2.6%, a difference of 1.4%.
Self-Care Disability Correlation Summary
| Measurement | Native Hawaiian | Immigrants from Senegal |
| Minimum | 0.72% | 0.36% |
| Maximum | 6.3% | 5.1% |
| Range | 5.6% | 4.8% |
| Mean | 2.7% | 2.6% |
| Median | 2.5% | 2.6% |
| Interquartile 25% (IQ1) | 2.1% | 2.2% |
| Interquartile 75% (IQ3) | 3.1% | 2.9% |
| Interquartile Range (IQR) | 0.98% | 0.75% |
| Standard Deviation (Sample) | 1.1% | 0.85% |
| Standard Deviation (Population) | 1.1% | 0.84% |
Similar Demographics by Self-Care Disability
Demographics Similar to Native Hawaiians by Self-Care Disability
In terms of self-care disability, the demographic groups most similar to Native Hawaiians are Samoan (2.6%, a difference of 0.020%), Ecuadorian (2.6%, a difference of 0.12%), Immigrants from Honduras (2.6%, a difference of 0.12%), Immigrants from Thailand (2.6%, a difference of 0.16%), and White/Caucasian (2.6%, a difference of 0.19%).
| Demographics | Rating | Rank | Self-Care Disability |
| Immigrants | Bahamas | 11.9 /100 | #204 | Poor 2.5% |
| Immigrants | Russia | 11.0 /100 | #205 | Poor 2.5% |
| Alaskan Athabascans | 10.4 /100 | #206 | Poor 2.5% |
| French | 9.9 /100 | #207 | Tragic 2.5% |
| Central Americans | 8.7 /100 | #208 | Tragic 2.5% |
| Malaysians | 7.7 /100 | #209 | Tragic 2.5% |
| Panamanians | 6.4 /100 | #210 | Tragic 2.5% |
| Native Hawaiians | 5.1 /100 | #211 | Tragic 2.6% |
| Samoans | 5.1 /100 | #212 | Tragic 2.6% |
| Ecuadorians | 4.7 /100 | #213 | Tragic 2.6% |
| Immigrants | Honduras | 4.7 /100 | #214 | Tragic 2.6% |
| Immigrants | Thailand | 4.5 /100 | #215 | Tragic 2.6% |
| Whites/Caucasians | 4.4 /100 | #216 | Tragic 2.6% |
| Celtics | 4.4 /100 | #217 | Tragic 2.6% |
| Scotch-Irish | 4.1 /100 | #218 | Tragic 2.6% |
Demographics Similar to Immigrants from Senegal by Self-Care Disability
In terms of self-care disability, the demographic groups most similar to Immigrants from Senegal are Bermudan (2.6%, a difference of 0.20%), Senegalese (2.6%, a difference of 0.26%), Bahamian (2.6%, a difference of 0.27%), Vietnamese (2.6%, a difference of 0.30%), and Liberian (2.6%, a difference of 0.31%).
| Demographics | Rating | Rank | Self-Care Disability |
| Immigrants | Ecuador | 2.5 /100 | #230 | Tragic 2.6% |
| Immigrants | Guatemala | 2.2 /100 | #231 | Tragic 2.6% |
| Albanians | 2.2 /100 | #232 | Tragic 2.6% |
| Liberians | 2.1 /100 | #233 | Tragic 2.6% |
| Vietnamese | 2.1 /100 | #234 | Tragic 2.6% |
| Bahamians | 2.0 /100 | #235 | Tragic 2.6% |
| Bermudans | 1.9 /100 | #236 | Tragic 2.6% |
| Immigrants | Senegal | 1.6 /100 | #237 | Tragic 2.6% |
| Senegalese | 1.3 /100 | #238 | Tragic 2.6% |
| Immigrants | Panama | 1.2 /100 | #239 | Tragic 2.6% |
| Marshallese | 1.2 /100 | #240 | Tragic 2.6% |
| Immigrants | Syria | 1.0 /100 | #241 | Tragic 2.6% |
| Spanish | 0.8 /100 | #242 | Tragic 2.6% |
| Hawaiians | 0.8 /100 | #243 | Tragic 2.6% |
| Yuman | 0.8 /100 | #244 | Tragic 2.6% |