Inupiat vs Immigrants from Senegal Self-Care Disability
COMPARE
Inupiat
Immigrants from Senegal
Self-Care Disability
Self-Care Disability Comparison
Inupiat
Immigrants from Senegal
2.2%
SELF-CARE DISABILITY
99.9/ 100
METRIC RATING
28th/ 347
METRIC RANK
2.6%
SELF-CARE DISABILITY
1.6/ 100
METRIC RATING
237th/ 347
METRIC RANK
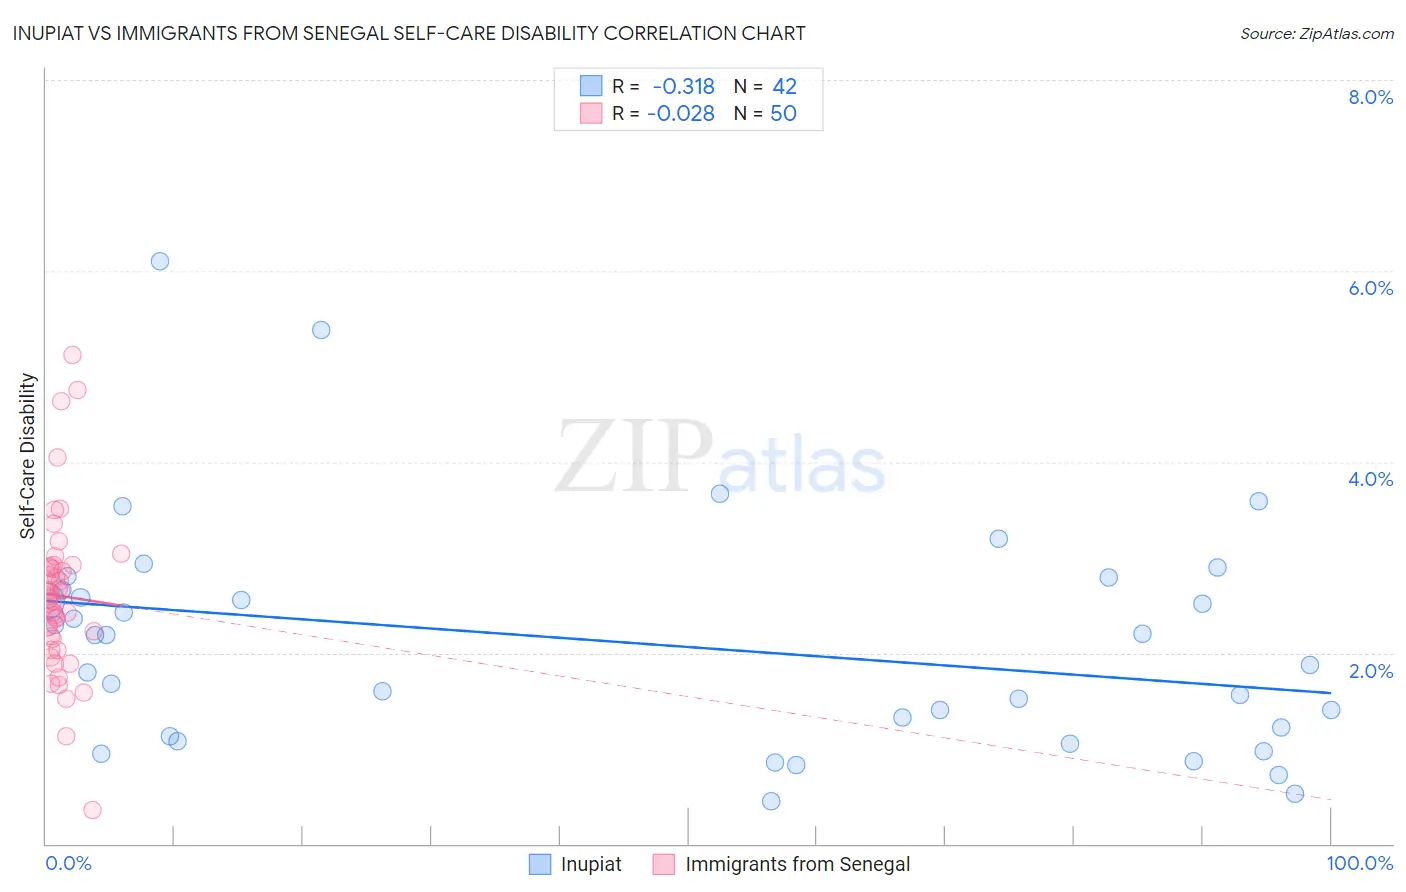
Inupiat vs Immigrants from Senegal Self-Care Disability Correlation Chart
The statistical analysis conducted on geographies consisting of 96,290,518 people shows a mild negative correlation between the proportion of Inupiat and percentage of population with self-care disability in the United States with a correlation coefficient (R) of -0.318 and weighted average of 2.2%. Similarly, the statistical analysis conducted on geographies consisting of 90,114,981 people shows no correlation between the proportion of Immigrants from Senegal and percentage of population with self-care disability in the United States with a correlation coefficient (R) of -0.028 and weighted average of 2.6%, a difference of 15.1%.
Self-Care Disability Correlation Summary
| Measurement | Inupiat | Immigrants from Senegal |
| Minimum | 0.45% | 0.36% |
| Maximum | 6.1% | 5.1% |
| Range | 5.7% | 4.8% |
| Mean | 2.1% | 2.6% |
| Median | 2.0% | 2.6% |
| Interquartile 25% (IQ1) | 1.1% | 2.2% |
| Interquartile 75% (IQ3) | 2.7% | 2.9% |
| Interquartile Range (IQR) | 1.5% | 0.75% |
| Standard Deviation (Sample) | 1.2% | 0.85% |
| Standard Deviation (Population) | 1.2% | 0.84% |
Similar Demographics by Self-Care Disability
Demographics Similar to Inupiat by Self-Care Disability
In terms of self-care disability, the demographic groups most similar to Inupiat are Immigrants from Zimbabwe (2.3%, a difference of 0.090%), Venezuelan (2.2%, a difference of 0.16%), Immigrants from Sri Lanka (2.2%, a difference of 0.17%), Turkish (2.2%, a difference of 0.24%), and Cypriot (2.2%, a difference of 0.35%).
| Demographics | Rating | Rank | Self-Care Disability |
| Bulgarians | 100.0 /100 | #21 | Exceptional 2.2% |
| Immigrants | Venezuela | 100.0 /100 | #22 | Exceptional 2.2% |
| Cambodians | 100.0 /100 | #23 | Exceptional 2.2% |
| Cypriots | 100.0 /100 | #24 | Exceptional 2.2% |
| Turks | 100.0 /100 | #25 | Exceptional 2.2% |
| Immigrants | Sri Lanka | 99.9 /100 | #26 | Exceptional 2.2% |
| Venezuelans | 99.9 /100 | #27 | Exceptional 2.2% |
| Inupiat | 99.9 /100 | #28 | Exceptional 2.2% |
| Immigrants | Zimbabwe | 99.9 /100 | #29 | Exceptional 2.3% |
| Paraguayans | 99.9 /100 | #30 | Exceptional 2.3% |
| Danes | 99.9 /100 | #31 | Exceptional 2.3% |
| Burmese | 99.9 /100 | #32 | Exceptional 2.3% |
| Immigrants | Korea | 99.9 /100 | #33 | Exceptional 2.3% |
| Immigrants | Turkey | 99.9 /100 | #34 | Exceptional 2.3% |
| Immigrants | Australia | 99.9 /100 | #35 | Exceptional 2.3% |
Demographics Similar to Immigrants from Senegal by Self-Care Disability
In terms of self-care disability, the demographic groups most similar to Immigrants from Senegal are Bermudan (2.6%, a difference of 0.20%), Senegalese (2.6%, a difference of 0.26%), Bahamian (2.6%, a difference of 0.27%), Vietnamese (2.6%, a difference of 0.30%), and Liberian (2.6%, a difference of 0.31%).
| Demographics | Rating | Rank | Self-Care Disability |
| Immigrants | Ecuador | 2.5 /100 | #230 | Tragic 2.6% |
| Immigrants | Guatemala | 2.2 /100 | #231 | Tragic 2.6% |
| Albanians | 2.2 /100 | #232 | Tragic 2.6% |
| Liberians | 2.1 /100 | #233 | Tragic 2.6% |
| Vietnamese | 2.1 /100 | #234 | Tragic 2.6% |
| Bahamians | 2.0 /100 | #235 | Tragic 2.6% |
| Bermudans | 1.9 /100 | #236 | Tragic 2.6% |
| Immigrants | Senegal | 1.6 /100 | #237 | Tragic 2.6% |
| Senegalese | 1.3 /100 | #238 | Tragic 2.6% |
| Immigrants | Panama | 1.2 /100 | #239 | Tragic 2.6% |
| Marshallese | 1.2 /100 | #240 | Tragic 2.6% |
| Immigrants | Syria | 1.0 /100 | #241 | Tragic 2.6% |
| Spanish | 0.8 /100 | #242 | Tragic 2.6% |
| Hawaiians | 0.8 /100 | #243 | Tragic 2.6% |
| Yuman | 0.8 /100 | #244 | Tragic 2.6% |