Native Hawaiian vs Immigrants from Romania Self-Care Disability
COMPARE
Native Hawaiian
Immigrants from Romania
Self-Care Disability
Self-Care Disability Comparison
Native Hawaiians
Immigrants from Romania
2.6%
SELF-CARE DISABILITY
5.1/ 100
METRIC RATING
211th/ 347
METRIC RANK
2.4%
SELF-CARE DISABILITY
89.3/ 100
METRIC RATING
129th/ 347
METRIC RANK
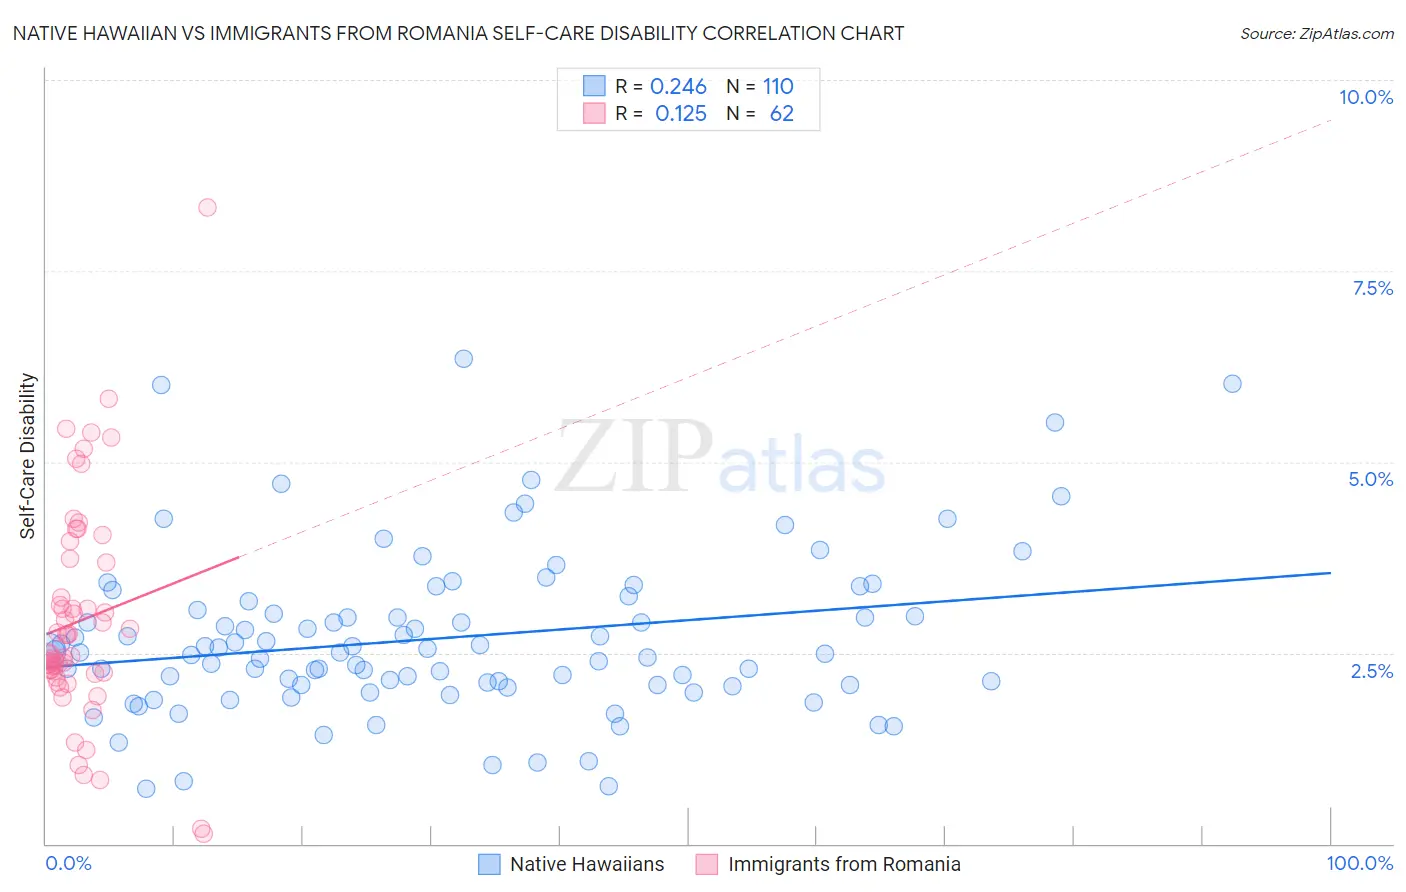
Native Hawaiian vs Immigrants from Romania Self-Care Disability Correlation Chart
The statistical analysis conducted on geographies consisting of 331,613,173 people shows a weak positive correlation between the proportion of Native Hawaiians and percentage of population with self-care disability in the United States with a correlation coefficient (R) of 0.246 and weighted average of 2.6%. Similarly, the statistical analysis conducted on geographies consisting of 256,851,853 people shows a poor positive correlation between the proportion of Immigrants from Romania and percentage of population with self-care disability in the United States with a correlation coefficient (R) of 0.125 and weighted average of 2.4%, a difference of 6.1%.
Self-Care Disability Correlation Summary
| Measurement | Native Hawaiian | Immigrants from Romania |
| Minimum | 0.72% | 0.12% |
| Maximum | 6.3% | 8.3% |
| Range | 5.6% | 8.2% |
| Mean | 2.7% | 2.9% |
| Median | 2.5% | 2.5% |
| Interquartile 25% (IQ1) | 2.1% | 2.2% |
| Interquartile 75% (IQ3) | 3.1% | 3.7% |
| Interquartile Range (IQR) | 0.98% | 1.5% |
| Standard Deviation (Sample) | 1.1% | 1.4% |
| Standard Deviation (Population) | 1.1% | 1.4% |
Similar Demographics by Self-Care Disability
Demographics Similar to Native Hawaiians by Self-Care Disability
In terms of self-care disability, the demographic groups most similar to Native Hawaiians are Samoan (2.6%, a difference of 0.020%), Ecuadorian (2.6%, a difference of 0.12%), Immigrants from Honduras (2.6%, a difference of 0.12%), Immigrants from Thailand (2.6%, a difference of 0.16%), and White/Caucasian (2.6%, a difference of 0.19%).
| Demographics | Rating | Rank | Self-Care Disability |
| Immigrants | Bahamas | 11.9 /100 | #204 | Poor 2.5% |
| Immigrants | Russia | 11.0 /100 | #205 | Poor 2.5% |
| Alaskan Athabascans | 10.4 /100 | #206 | Poor 2.5% |
| French | 9.9 /100 | #207 | Tragic 2.5% |
| Central Americans | 8.7 /100 | #208 | Tragic 2.5% |
| Malaysians | 7.7 /100 | #209 | Tragic 2.5% |
| Panamanians | 6.4 /100 | #210 | Tragic 2.5% |
| Native Hawaiians | 5.1 /100 | #211 | Tragic 2.6% |
| Samoans | 5.1 /100 | #212 | Tragic 2.6% |
| Ecuadorians | 4.7 /100 | #213 | Tragic 2.6% |
| Immigrants | Honduras | 4.7 /100 | #214 | Tragic 2.6% |
| Immigrants | Thailand | 4.5 /100 | #215 | Tragic 2.6% |
| Whites/Caucasians | 4.4 /100 | #216 | Tragic 2.6% |
| Celtics | 4.4 /100 | #217 | Tragic 2.6% |
| Scotch-Irish | 4.1 /100 | #218 | Tragic 2.6% |
Demographics Similar to Immigrants from Romania by Self-Care Disability
In terms of self-care disability, the demographic groups most similar to Immigrants from Romania are Immigrants from Austria (2.4%, a difference of 0.030%), Immigrants from Hungary (2.4%, a difference of 0.050%), Polish (2.4%, a difference of 0.050%), Immigrants from South America (2.4%, a difference of 0.050%), and Colombian (2.4%, a difference of 0.060%).
| Demographics | Rating | Rank | Self-Care Disability |
| Belgians | 90.9 /100 | #122 | Exceptional 2.4% |
| Immigrants | Nigeria | 90.3 /100 | #123 | Exceptional 2.4% |
| Immigrants | Morocco | 90.2 /100 | #124 | Exceptional 2.4% |
| Immigrants | North America | 90.2 /100 | #124 | Exceptional 2.4% |
| Hmong | 89.9 /100 | #126 | Excellent 2.4% |
| Colombians | 89.7 /100 | #127 | Excellent 2.4% |
| Immigrants | Hungary | 89.6 /100 | #128 | Excellent 2.4% |
| Immigrants | Romania | 89.3 /100 | #129 | Excellent 2.4% |
| Immigrants | Austria | 89.0 /100 | #130 | Excellent 2.4% |
| Poles | 88.9 /100 | #131 | Excellent 2.4% |
| Immigrants | South America | 88.8 /100 | #132 | Excellent 2.4% |
| Immigrants | Colombia | 88.5 /100 | #133 | Excellent 2.4% |
| Russians | 88.2 /100 | #134 | Excellent 2.4% |
| Laotians | 87.8 /100 | #135 | Excellent 2.4% |
| South American Indians | 87.2 /100 | #136 | Excellent 2.4% |