Native Hawaiian vs Immigrants from Romania 8th Grade
COMPARE
Native Hawaiian
Immigrants from Romania
8th Grade
8th Grade Comparison
Native Hawaiians
Immigrants from Romania
96.6%
8TH GRADE
99.7/ 100
METRIC RATING
65th/ 347
METRIC RANK
96.2%
8TH GRADE
94.1/ 100
METRIC RATING
125th/ 347
METRIC RANK
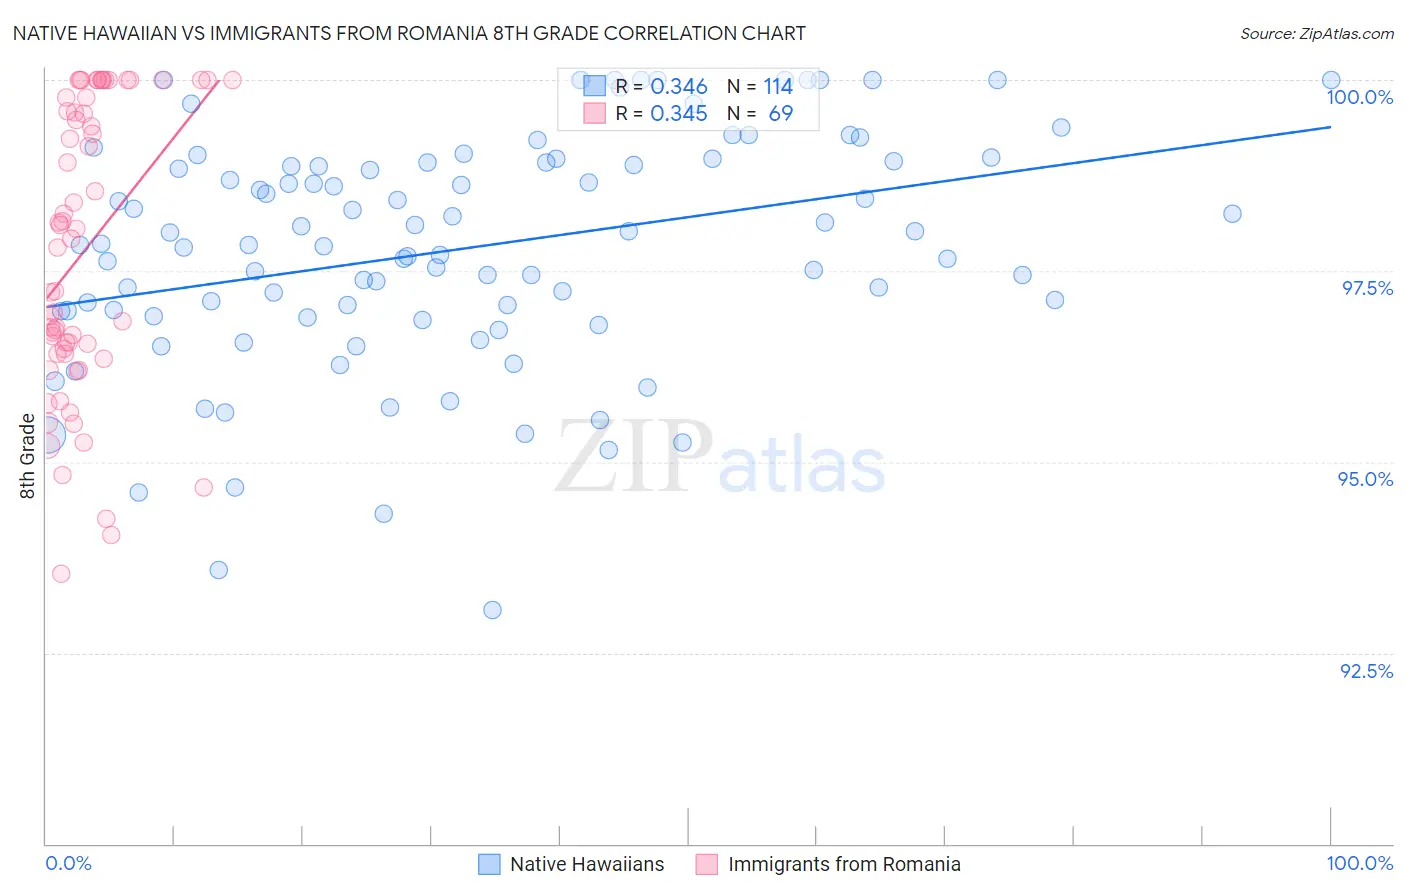
Native Hawaiian vs Immigrants from Romania 8th Grade Correlation Chart
The statistical analysis conducted on geographies consisting of 332,101,429 people shows a mild positive correlation between the proportion of Native Hawaiians and percentage of population with at least 8th grade education in the United States with a correlation coefficient (R) of 0.346 and weighted average of 96.6%. Similarly, the statistical analysis conducted on geographies consisting of 257,008,799 people shows a mild positive correlation between the proportion of Immigrants from Romania and percentage of population with at least 8th grade education in the United States with a correlation coefficient (R) of 0.345 and weighted average of 96.2%, a difference of 0.50%.
8th Grade Correlation Summary
| Measurement | Native Hawaiian | Immigrants from Romania |
| Minimum | 93.1% | 93.5% |
| Maximum | 100.0% | 100.0% |
| Range | 6.9% | 6.5% |
| Mean | 97.8% | 97.8% |
| Median | 97.8% | 97.9% |
| Interquartile 25% (IQ1) | 97.0% | 96.4% |
| Interquartile 75% (IQ3) | 98.9% | 99.8% |
| Interquartile Range (IQR) | 1.9% | 3.4% |
| Standard Deviation (Sample) | 1.5% | 1.9% |
| Standard Deviation (Population) | 1.5% | 1.9% |
Similar Demographics by 8th Grade
Demographics Similar to Native Hawaiians by 8th Grade
In terms of 8th grade, the demographic groups most similar to Native Hawaiians are Ukrainian (96.7%, a difference of 0.0%), Immigrants from India (96.6%, a difference of 0.0%), Canadian (96.6%, a difference of 0.0%), Iranian (96.6%, a difference of 0.010%), and White/Caucasian (96.7%, a difference of 0.020%).
| Demographics | Rating | Rank | 8th Grade |
| Immigrants | Canada | 99.8 /100 | #58 | Exceptional 96.7% |
| Immigrants | North America | 99.8 /100 | #59 | Exceptional 96.7% |
| Immigrants | Northern Europe | 99.8 /100 | #60 | Exceptional 96.7% |
| Immigrants | Austria | 99.8 /100 | #61 | Exceptional 96.7% |
| Whites/Caucasians | 99.8 /100 | #62 | Exceptional 96.7% |
| Ukrainians | 99.7 /100 | #63 | Exceptional 96.7% |
| Immigrants | India | 99.7 /100 | #64 | Exceptional 96.6% |
| Native Hawaiians | 99.7 /100 | #65 | Exceptional 96.6% |
| Canadians | 99.7 /100 | #66 | Exceptional 96.6% |
| Iranians | 99.7 /100 | #67 | Exceptional 96.6% |
| Creek | 99.7 /100 | #68 | Exceptional 96.6% |
| Americans | 99.7 /100 | #69 | Exceptional 96.6% |
| Immigrants | Lithuania | 99.6 /100 | #70 | Exceptional 96.6% |
| New Zealanders | 99.5 /100 | #71 | Exceptional 96.6% |
| Immigrants | England | 99.5 /100 | #72 | Exceptional 96.6% |
Demographics Similar to Immigrants from Romania by 8th Grade
In terms of 8th grade, the demographic groups most similar to Immigrants from Romania are Choctaw (96.2%, a difference of 0.0%), Immigrants from Serbia (96.2%, a difference of 0.0%), Palestinian (96.2%, a difference of 0.010%), Immigrants from Bosnia and Herzegovina (96.2%, a difference of 0.010%), and Filipino (96.2%, a difference of 0.020%).
| Demographics | Rating | Rank | 8th Grade |
| Immigrants | Norway | 95.7 /100 | #118 | Exceptional 96.2% |
| Immigrants | Switzerland | 95.3 /100 | #119 | Exceptional 96.2% |
| Immigrants | France | 95.3 /100 | #120 | Exceptional 96.2% |
| Immigrants | Bulgaria | 95.3 /100 | #121 | Exceptional 96.2% |
| Immigrants | Europe | 95.3 /100 | #122 | Exceptional 96.2% |
| Filipinos | 94.6 /100 | #123 | Exceptional 96.2% |
| Palestinians | 94.6 /100 | #124 | Exceptional 96.2% |
| Immigrants | Romania | 94.1 /100 | #125 | Exceptional 96.2% |
| Choctaw | 94.0 /100 | #126 | Exceptional 96.2% |
| Immigrants | Serbia | 94.0 /100 | #127 | Exceptional 96.2% |
| Immigrants | Bosnia and Herzegovina | 93.9 /100 | #128 | Exceptional 96.2% |
| Cheyenne | 93.3 /100 | #129 | Exceptional 96.1% |
| Soviet Union | 92.6 /100 | #130 | Exceptional 96.1% |
| Pueblo | 92.3 /100 | #131 | Exceptional 96.1% |
| Immigrants | Kuwait | 92.2 /100 | #132 | Exceptional 96.1% |