Immigrants from Sweden vs Immigrants from Cambodia Male Disability
COMPARE
Immigrants from Sweden
Immigrants from Cambodia
Male Disability
Male Disability Comparison
Immigrants from Sweden
Immigrants from Cambodia
10.7%
MALE DISABILITY
96.9/ 100
METRIC RATING
94th/ 347
METRIC RANK
11.5%
MALE DISABILITY
10.8/ 100
METRIC RATING
204th/ 347
METRIC RANK
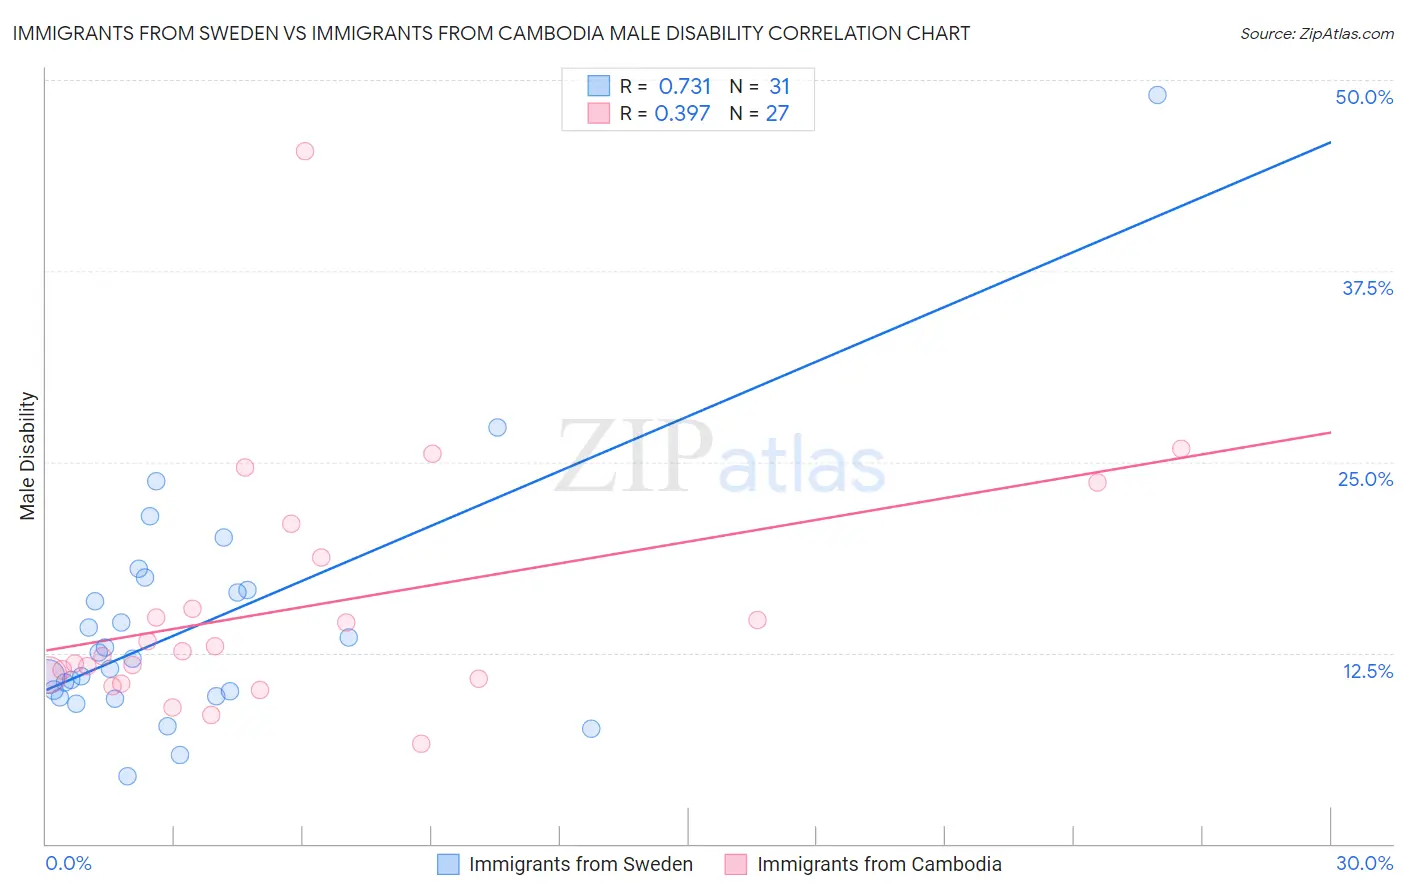
Immigrants from Sweden vs Immigrants from Cambodia Male Disability Correlation Chart
The statistical analysis conducted on geographies consisting of 164,748,272 people shows a strong positive correlation between the proportion of Immigrants from Sweden and percentage of males with a disability in the United States with a correlation coefficient (R) of 0.731 and weighted average of 10.7%. Similarly, the statistical analysis conducted on geographies consisting of 205,155,985 people shows a mild positive correlation between the proportion of Immigrants from Cambodia and percentage of males with a disability in the United States with a correlation coefficient (R) of 0.397 and weighted average of 11.5%, a difference of 8.1%.
Male Disability Correlation Summary
| Measurement | Immigrants from Sweden | Immigrants from Cambodia |
| Minimum | 4.4% | 6.5% |
| Maximum | 49.0% | 45.3% |
| Range | 44.6% | 38.8% |
| Mean | 14.3% | 15.5% |
| Median | 12.1% | 12.6% |
| Interquartile 25% (IQ1) | 9.7% | 10.8% |
| Interquartile 75% (IQ3) | 16.6% | 18.7% |
| Interquartile Range (IQR) | 6.9% | 7.9% |
| Standard Deviation (Sample) | 8.2% | 8.0% |
| Standard Deviation (Population) | 8.1% | 7.9% |
Similar Demographics by Male Disability
Demographics Similar to Immigrants from Sweden by Male Disability
In terms of male disability, the demographic groups most similar to Immigrants from Sweden are Chilean (10.7%, a difference of 0.030%), Immigrants from St. Vincent and the Grenadines (10.7%, a difference of 0.11%), Nicaraguan (10.7%, a difference of 0.13%), Immigrants from Armenia (10.7%, a difference of 0.15%), and Immigrants from Romania (10.7%, a difference of 0.21%).
| Demographics | Rating | Rank | Male Disability |
| Immigrants | Vietnam | 97.9 /100 | #87 | Exceptional 10.6% |
| Immigrants | Western Asia | 97.8 /100 | #88 | Exceptional 10.6% |
| Immigrants | Nicaragua | 97.8 /100 | #89 | Exceptional 10.6% |
| Immigrants | Morocco | 97.7 /100 | #90 | Exceptional 10.6% |
| Immigrants | France | 97.6 /100 | #91 | Exceptional 10.6% |
| Palestinians | 97.4 /100 | #92 | Exceptional 10.7% |
| Immigrants | St. Vincent and the Grenadines | 97.1 /100 | #93 | Exceptional 10.7% |
| Immigrants | Sweden | 96.9 /100 | #94 | Exceptional 10.7% |
| Chileans | 96.9 /100 | #95 | Exceptional 10.7% |
| Nicaraguans | 96.6 /100 | #96 | Exceptional 10.7% |
| Immigrants | Armenia | 96.6 /100 | #97 | Exceptional 10.7% |
| Immigrants | Romania | 96.5 /100 | #98 | Exceptional 10.7% |
| Immigrants | Switzerland | 96.1 /100 | #99 | Exceptional 10.7% |
| Immigrants | Kazakhstan | 95.9 /100 | #100 | Exceptional 10.7% |
| Immigrants | Greece | 95.6 /100 | #101 | Exceptional 10.7% |
Demographics Similar to Immigrants from Cambodia by Male Disability
In terms of male disability, the demographic groups most similar to Immigrants from Cambodia are Serbian (11.5%, a difference of 0.0%), Jamaican (11.5%, a difference of 0.010%), Ukrainian (11.5%, a difference of 0.010%), Immigrants from Somalia (11.5%, a difference of 0.050%), and Icelander (11.6%, a difference of 0.090%).
| Demographics | Rating | Rank | Male Disability |
| Somalis | 18.2 /100 | #197 | Poor 11.4% |
| Immigrants | Jamaica | 16.3 /100 | #198 | Poor 11.5% |
| Lebanese | 15.4 /100 | #199 | Poor 11.5% |
| Immigrants | Iraq | 13.0 /100 | #200 | Poor 11.5% |
| Immigrants | Panama | 13.0 /100 | #201 | Poor 11.5% |
| Immigrants | Mexico | 12.6 /100 | #202 | Poor 11.5% |
| Jamaicans | 10.9 /100 | #203 | Poor 11.5% |
| Immigrants | Cambodia | 10.8 /100 | #204 | Poor 11.5% |
| Serbians | 10.7 /100 | #205 | Poor 11.5% |
| Ukrainians | 10.6 /100 | #206 | Poor 11.5% |
| Immigrants | Somalia | 10.4 /100 | #207 | Poor 11.5% |
| Icelanders | 10.1 /100 | #208 | Poor 11.6% |
| Spanish American Indians | 10.1 /100 | #209 | Poor 11.6% |
| Ute | 9.4 /100 | #210 | Tragic 11.6% |
| Immigrants | Thailand | 8.4 /100 | #211 | Tragic 11.6% |