Native Hawaiian vs Immigrants from Cambodia In Labor Force | Age 35-44
COMPARE
Native Hawaiian
Immigrants from Cambodia
In Labor Force | Age 35-44
In Labor Force | Age 35-44 Comparison
Native Hawaiians
Immigrants from Cambodia
83.9%
IN LABOR FORCE | AGE 35-44
3.0/ 100
METRIC RATING
232nd/ 347
METRIC RANK
83.8%
IN LABOR FORCE | AGE 35-44
1.1/ 100
METRIC RATING
242nd/ 347
METRIC RANK
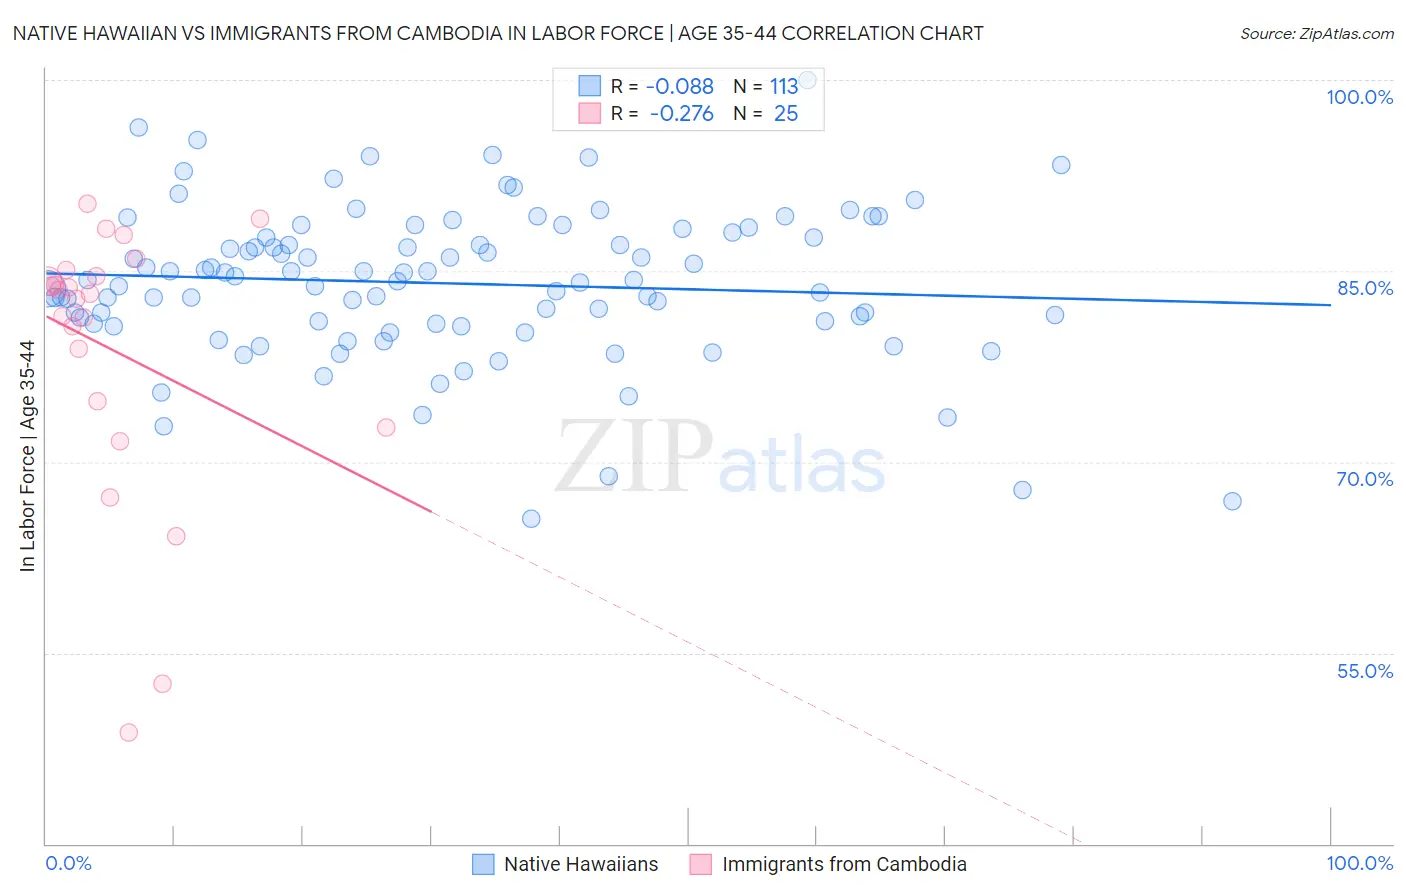
Native Hawaiian vs Immigrants from Cambodia In Labor Force | Age 35-44 Correlation Chart
The statistical analysis conducted on geographies consisting of 331,970,144 people shows a slight negative correlation between the proportion of Native Hawaiians and labor force participation rate among population between the ages 35 and 44 in the United States with a correlation coefficient (R) of -0.088 and weighted average of 83.9%. Similarly, the statistical analysis conducted on geographies consisting of 205,131,039 people shows a weak negative correlation between the proportion of Immigrants from Cambodia and labor force participation rate among population between the ages 35 and 44 in the United States with a correlation coefficient (R) of -0.276 and weighted average of 83.8%, a difference of 0.16%.
In Labor Force | Age 35-44 Correlation Summary
| Measurement | Native Hawaiian | Immigrants from Cambodia |
| Minimum | 65.6% | 48.7% |
| Maximum | 100.0% | 90.3% |
| Range | 34.4% | 41.6% |
| Mean | 84.0% | 78.8% |
| Median | 84.3% | 83.2% |
| Interquartile 25% (IQ1) | 80.9% | 73.7% |
| Interquartile 75% (IQ3) | 87.8% | 84.8% |
| Interquartile Range (IQR) | 7.0% | 11.1% |
| Standard Deviation (Sample) | 6.0% | 10.7% |
| Standard Deviation (Population) | 6.0% | 10.5% |
Demographics Similar to Native Hawaiians and Immigrants from Cambodia by In Labor Force | Age 35-44
In terms of in labor force | age 35-44, the demographic groups most similar to Native Hawaiians are Scottish (83.9%, a difference of 0.010%), Immigrants from Germany (83.9%, a difference of 0.010%), Immigrants from Oceania (83.9%, a difference of 0.020%), Immigrants from Syria (83.9%, a difference of 0.030%), and Immigrants from Iraq (83.9%, a difference of 0.040%). Similarly, the demographic groups most similar to Immigrants from Cambodia are Immigrants from Western Asia (83.8%, a difference of 0.0%), Guyanese (83.8%, a difference of 0.010%), Malaysian (83.8%, a difference of 0.010%), Iraqi (83.8%, a difference of 0.020%), and Immigrants (83.7%, a difference of 0.020%).
| Demographics | Rating | Rank | In Labor Force | Age 35-44 |
| British West Indians | 5.3 /100 | #227 | Tragic 84.0% |
| Welsh | 5.3 /100 | #228 | Tragic 84.0% |
| Immigrants | Thailand | 4.7 /100 | #229 | Tragic 84.0% |
| Immigrants | Iraq | 3.7 /100 | #230 | Tragic 83.9% |
| Scottish | 3.2 /100 | #231 | Tragic 83.9% |
| Native Hawaiians | 3.0 /100 | #232 | Tragic 83.9% |
| Immigrants | Germany | 2.8 /100 | #233 | Tragic 83.9% |
| Immigrants | Oceania | 2.6 /100 | #234 | Tragic 83.9% |
| Immigrants | Syria | 2.5 /100 | #235 | Tragic 83.9% |
| West Indians | 2.4 /100 | #236 | Tragic 83.9% |
| English | 1.8 /100 | #237 | Tragic 83.8% |
| Immigrants | Laos | 1.7 /100 | #238 | Tragic 83.8% |
| Celtics | 1.4 /100 | #239 | Tragic 83.8% |
| Arabs | 1.3 /100 | #240 | Tragic 83.8% |
| Iraqis | 1.3 /100 | #241 | Tragic 83.8% |
| Immigrants | Cambodia | 1.1 /100 | #242 | Tragic 83.8% |
| Immigrants | Western Asia | 1.1 /100 | #243 | Tragic 83.8% |
| Guyanese | 1.1 /100 | #244 | Tragic 83.8% |
| Malaysians | 1.1 /100 | #245 | Tragic 83.8% |
| Immigrants | Immigrants | 1.0 /100 | #246 | Tragic 83.7% |
| Immigrants | Armenia | 0.9 /100 | #247 | Tragic 83.7% |