Native Hawaiian vs Immigrants from Cambodia Unemployment Among Ages 30 to 34 years
COMPARE
Native Hawaiian
Immigrants from Cambodia
Unemployment Among Ages 30 to 34 years
Unemployment Among Ages 30 to 34 years Comparison
Native Hawaiians
Immigrants from Cambodia
5.9%
UNEMPLOYMENT AMONG AGES 30 TO 34 YEARS
0.7/ 100
METRIC RATING
236th/ 347
METRIC RANK
5.7%
UNEMPLOYMENT AMONG AGES 30 TO 34 YEARS
5.8/ 100
METRIC RATING
215th/ 347
METRIC RANK
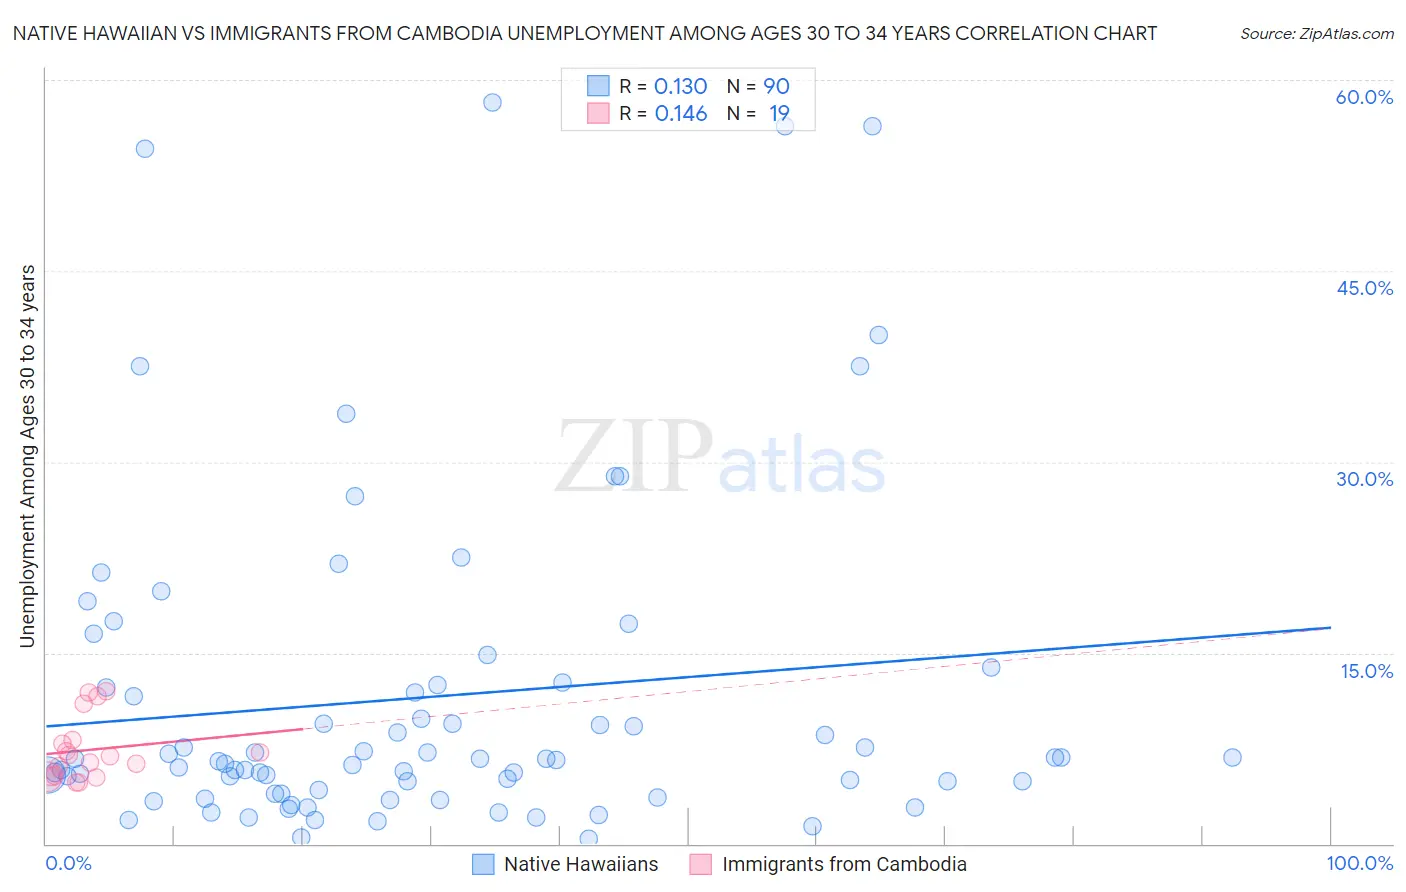
Native Hawaiian vs Immigrants from Cambodia Unemployment Among Ages 30 to 34 years Correlation Chart
The statistical analysis conducted on geographies consisting of 317,081,613 people shows a poor positive correlation between the proportion of Native Hawaiians and unemployment rate among population between the ages 30 and 34 in the United States with a correlation coefficient (R) of 0.130 and weighted average of 5.9%. Similarly, the statistical analysis conducted on geographies consisting of 200,562,885 people shows a poor positive correlation between the proportion of Immigrants from Cambodia and unemployment rate among population between the ages 30 and 34 in the United States with a correlation coefficient (R) of 0.146 and weighted average of 5.7%, a difference of 3.6%.
Unemployment Among Ages 30 to 34 years Correlation Summary
| Measurement | Native Hawaiian | Immigrants from Cambodia |
| Minimum | 0.40% | 4.8% |
| Maximum | 58.2% | 12.0% |
| Range | 57.8% | 7.2% |
| Mean | 11.5% | 7.4% |
| Median | 6.6% | 6.9% |
| Interquartile 25% (IQ1) | 4.2% | 5.3% |
| Interquartile 75% (IQ3) | 12.5% | 8.1% |
| Interquartile Range (IQR) | 8.3% | 2.8% |
| Standard Deviation (Sample) | 13.0% | 2.5% |
| Standard Deviation (Population) | 12.9% | 2.4% |
Similar Demographics by Unemployment Among Ages 30 to 34 years
Demographics Similar to Native Hawaiians by Unemployment Among Ages 30 to 34 years
In terms of unemployment among ages 30 to 34 years, the demographic groups most similar to Native Hawaiians are Yaqui (5.9%, a difference of 0.12%), Central American (5.9%, a difference of 0.17%), Portuguese (5.9%, a difference of 0.24%), Mexican American Indian (5.9%, a difference of 0.26%), and Nepalese (5.9%, a difference of 0.27%).
| Demographics | Rating | Rank | Unemployment Among Ages 30 to 34 years |
| Immigrants | Uzbekistan | 1.5 /100 | #229 | Tragic 5.9% |
| Hawaiians | 1.2 /100 | #230 | Tragic 5.9% |
| Japanese | 1.1 /100 | #231 | Tragic 5.9% |
| Iroquois | 1.0 /100 | #232 | Tragic 5.9% |
| Nepalese | 0.8 /100 | #233 | Tragic 5.9% |
| Portuguese | 0.8 /100 | #234 | Tragic 5.9% |
| Yaqui | 0.7 /100 | #235 | Tragic 5.9% |
| Native Hawaiians | 0.7 /100 | #236 | Tragic 5.9% |
| Central Americans | 0.6 /100 | #237 | Tragic 5.9% |
| Mexican American Indians | 0.6 /100 | #238 | Tragic 5.9% |
| Immigrants | Nigeria | 0.6 /100 | #239 | Tragic 6.0% |
| Salvadorans | 0.5 /100 | #240 | Tragic 6.0% |
| Immigrants | El Salvador | 0.5 /100 | #241 | Tragic 6.0% |
| Guatemalans | 0.4 /100 | #242 | Tragic 6.0% |
| Immigrants | Liberia | 0.4 /100 | #243 | Tragic 6.0% |
Demographics Similar to Immigrants from Cambodia by Unemployment Among Ages 30 to 34 years
In terms of unemployment among ages 30 to 34 years, the demographic groups most similar to Immigrants from Cambodia are Immigrants from Panama (5.7%, a difference of 0.010%), Immigrants from Syria (5.7%, a difference of 0.11%), Immigrants from Fiji (5.7%, a difference of 0.24%), Immigrants (5.7%, a difference of 0.35%), and Panamanian (5.8%, a difference of 0.46%).
| Demographics | Rating | Rank | Unemployment Among Ages 30 to 34 years |
| Immigrants | Philippines | 11.5 /100 | #208 | Poor 5.7% |
| French | 10.8 /100 | #209 | Poor 5.7% |
| Whites/Caucasians | 9.2 /100 | #210 | Tragic 5.7% |
| Spanish American Indians | 8.7 /100 | #211 | Tragic 5.7% |
| Scotch-Irish | 8.6 /100 | #212 | Tragic 5.7% |
| Immigrants | Immigrants | 7.1 /100 | #213 | Tragic 5.7% |
| Immigrants | Panama | 5.9 /100 | #214 | Tragic 5.7% |
| Immigrants | Cambodia | 5.8 /100 | #215 | Tragic 5.7% |
| Immigrants | Syria | 5.5 /100 | #216 | Tragic 5.7% |
| Immigrants | Fiji | 5.1 /100 | #217 | Tragic 5.7% |
| Panamanians | 4.5 /100 | #218 | Tragic 5.8% |
| French Canadians | 4.4 /100 | #219 | Tragic 5.8% |
| Sierra Leoneans | 3.9 /100 | #220 | Tragic 5.8% |
| Guamanians/Chamorros | 3.9 /100 | #221 | Tragic 5.8% |
| Spaniards | 3.2 /100 | #222 | Tragic 5.8% |