Moroccan vs Tongan Disability
COMPARE
Moroccan
Tongan
Disability
Disability Comparison
Moroccans
Tongans
11.5%
DISABILITY
83.3/ 100
METRIC RATING
143rd/ 347
METRIC RANK
10.8%
DISABILITY
99.9/ 100
METRIC RATING
46th/ 347
METRIC RANK
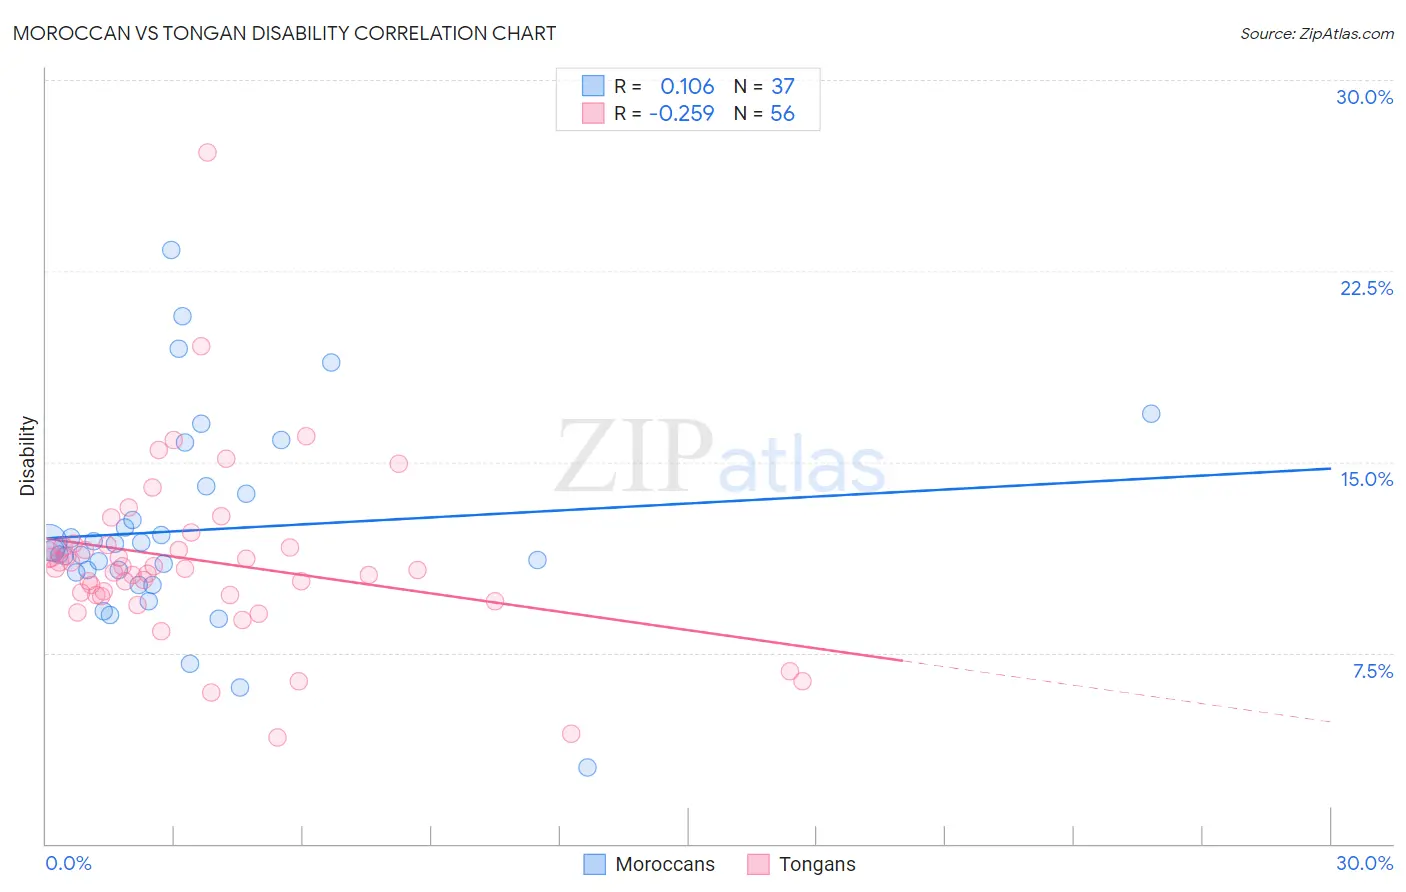
Moroccan vs Tongan Disability Correlation Chart
The statistical analysis conducted on geographies consisting of 201,799,768 people shows a poor positive correlation between the proportion of Moroccans and percentage of population with a disability in the United States with a correlation coefficient (R) of 0.106 and weighted average of 11.5%. Similarly, the statistical analysis conducted on geographies consisting of 102,894,634 people shows a weak negative correlation between the proportion of Tongans and percentage of population with a disability in the United States with a correlation coefficient (R) of -0.259 and weighted average of 10.8%, a difference of 6.1%.
Disability Correlation Summary
| Measurement | Moroccan | Tongan |
| Minimum | 3.0% | 4.2% |
| Maximum | 23.3% | 27.1% |
| Range | 20.3% | 23.0% |
| Mean | 12.3% | 11.1% |
| Median | 11.5% | 10.8% |
| Interquartile 25% (IQ1) | 10.4% | 9.8% |
| Interquartile 75% (IQ3) | 13.9% | 11.7% |
| Interquartile Range (IQR) | 3.5% | 1.9% |
| Standard Deviation (Sample) | 4.0% | 3.5% |
| Standard Deviation (Population) | 3.9% | 3.5% |
Similar Demographics by Disability
Demographics Similar to Moroccans by Disability
In terms of disability, the demographic groups most similar to Moroccans are Australian (11.5%, a difference of 0.070%), Nigerian (11.5%, a difference of 0.15%), Immigrants from Sudan (11.5%, a difference of 0.17%), Immigrants from Grenada (11.5%, a difference of 0.25%), and Russian (11.5%, a difference of 0.31%).
| Demographics | Rating | Rank | Disability |
| Immigrants | St. Vincent and the Grenadines | 87.8 /100 | #136 | Excellent 11.4% |
| Kenyans | 87.1 /100 | #137 | Excellent 11.5% |
| New Zealanders | 87.0 /100 | #138 | Excellent 11.5% |
| Ghanaians | 87.0 /100 | #139 | Excellent 11.5% |
| Russians | 86.8 /100 | #140 | Excellent 11.5% |
| Immigrants | Grenada | 86.1 /100 | #141 | Excellent 11.5% |
| Immigrants | Sudan | 85.3 /100 | #142 | Excellent 11.5% |
| Moroccans | 83.3 /100 | #143 | Excellent 11.5% |
| Australians | 82.5 /100 | #144 | Excellent 11.5% |
| Nigerians | 81.3 /100 | #145 | Excellent 11.5% |
| Immigrants | Hungary | 79.0 /100 | #146 | Good 11.5% |
| Immigrants | Ukraine | 77.6 /100 | #147 | Good 11.5% |
| Sudanese | 77.1 /100 | #148 | Good 11.5% |
| Immigrants | Norway | 73.2 /100 | #149 | Good 11.6% |
| Romanians | 72.7 /100 | #150 | Good 11.6% |
Demographics Similar to Tongans by Disability
In terms of disability, the demographic groups most similar to Tongans are Immigrants from Peru (10.8%, a difference of 0.010%), Taiwanese (10.8%, a difference of 0.010%), Soviet Union (10.9%, a difference of 0.20%), Vietnamese (10.9%, a difference of 0.26%), and Immigrants from Saudi Arabia (10.9%, a difference of 0.26%).
| Demographics | Rating | Rank | Disability |
| Cambodians | 99.9 /100 | #39 | Exceptional 10.8% |
| Mongolians | 99.9 /100 | #40 | Exceptional 10.8% |
| Immigrants | Australia | 99.9 /100 | #41 | Exceptional 10.8% |
| Immigrants | Nepal | 99.9 /100 | #42 | Exceptional 10.8% |
| Israelis | 99.9 /100 | #43 | Exceptional 10.8% |
| Immigrants | Japan | 99.9 /100 | #44 | Exceptional 10.8% |
| Immigrants | Peru | 99.9 /100 | #45 | Exceptional 10.8% |
| Tongans | 99.9 /100 | #46 | Exceptional 10.8% |
| Taiwanese | 99.9 /100 | #47 | Exceptional 10.8% |
| Soviet Union | 99.9 /100 | #48 | Exceptional 10.9% |
| Vietnamese | 99.9 /100 | #49 | Exceptional 10.9% |
| Immigrants | Saudi Arabia | 99.9 /100 | #50 | Exceptional 10.9% |
| Peruvians | 99.8 /100 | #51 | Exceptional 10.9% |
| South Americans | 99.8 /100 | #52 | Exceptional 10.9% |
| Immigrants | Spain | 99.8 /100 | #53 | Exceptional 10.9% |