Mongolian vs Spanish American Indian Self-Care Disability
COMPARE
Mongolian
Spanish American Indian
Self-Care Disability
Self-Care Disability Comparison
Mongolians
Spanish American Indians
2.3%
SELF-CARE DISABILITY
99.3/ 100
METRIC RATING
63rd/ 347
METRIC RANK
2.9%
SELF-CARE DISABILITY
0.0/ 100
METRIC RATING
319th/ 347
METRIC RANK
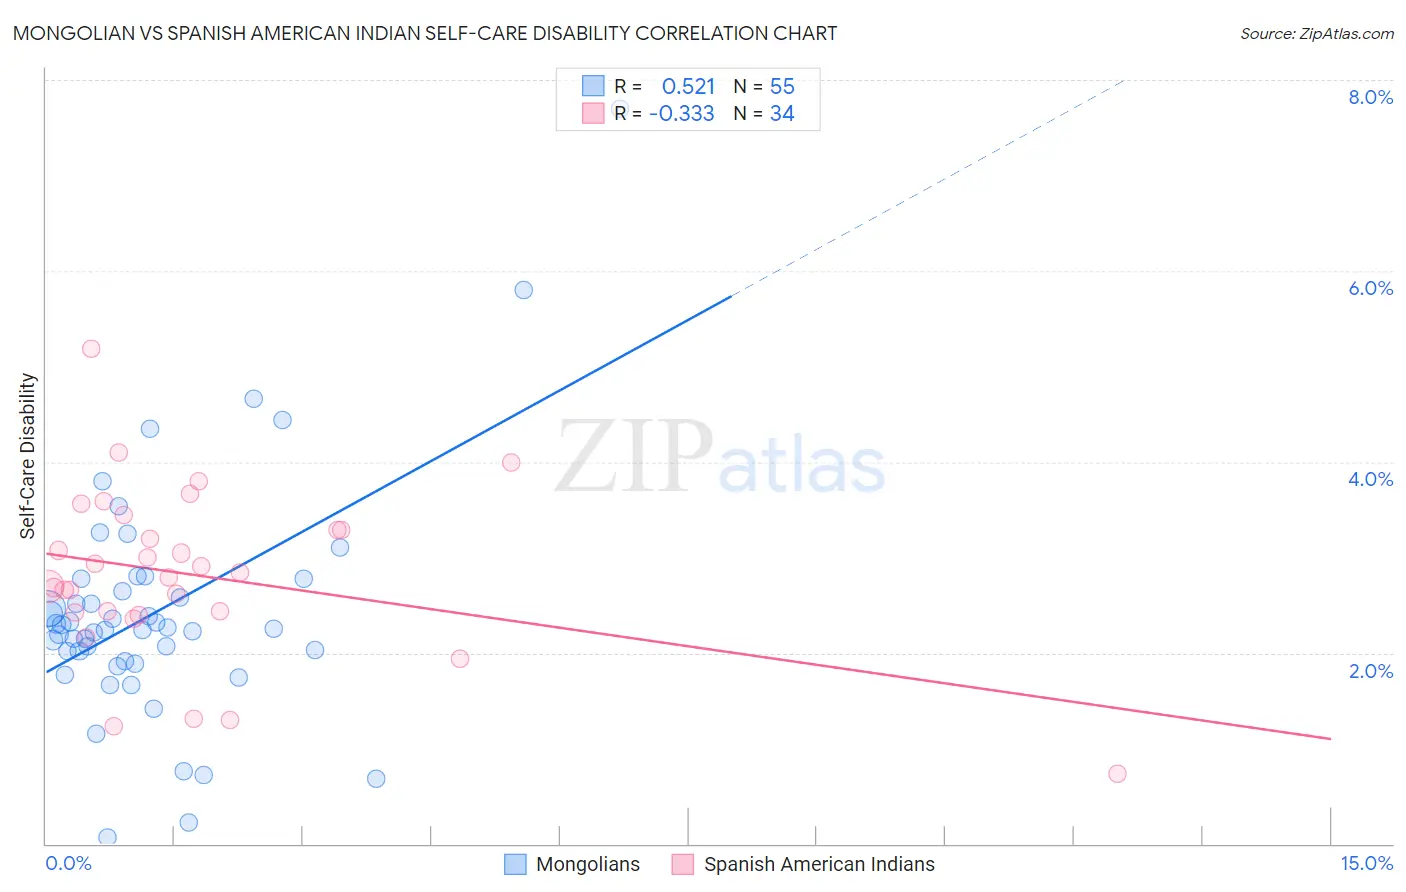
Mongolian vs Spanish American Indian Self-Care Disability Correlation Chart
The statistical analysis conducted on geographies consisting of 140,258,079 people shows a substantial positive correlation between the proportion of Mongolians and percentage of population with self-care disability in the United States with a correlation coefficient (R) of 0.521 and weighted average of 2.3%. Similarly, the statistical analysis conducted on geographies consisting of 73,138,430 people shows a mild negative correlation between the proportion of Spanish American Indians and percentage of population with self-care disability in the United States with a correlation coefficient (R) of -0.333 and weighted average of 2.9%, a difference of 23.0%.
Self-Care Disability Correlation Summary
| Measurement | Mongolian | Spanish American Indian |
| Minimum | 0.065% | 0.73% |
| Maximum | 7.7% | 5.2% |
| Range | 7.6% | 4.4% |
| Mean | 2.4% | 2.8% |
| Median | 2.2% | 2.8% |
| Interquartile 25% (IQ1) | 1.9% | 2.4% |
| Interquartile 75% (IQ3) | 2.8% | 3.3% |
| Interquartile Range (IQR) | 0.86% | 0.86% |
| Standard Deviation (Sample) | 1.2% | 0.89% |
| Standard Deviation (Population) | 1.2% | 0.88% |
Similar Demographics by Self-Care Disability
Demographics Similar to Mongolians by Self-Care Disability
In terms of self-care disability, the demographic groups most similar to Mongolians are Swedish (2.3%, a difference of 0.010%), Brazilian (2.3%, a difference of 0.070%), Egyptian (2.3%, a difference of 0.090%), Immigrants from Argentina (2.3%, a difference of 0.10%), and South African (2.3%, a difference of 0.13%).
| Demographics | Rating | Rank | Self-Care Disability |
| Immigrants | Eastern Asia | 99.6 /100 | #56 | Exceptional 2.3% |
| Immigrants | Belgium | 99.6 /100 | #57 | Exceptional 2.3% |
| Immigrants | Cameroon | 99.6 /100 | #58 | Exceptional 2.3% |
| New Zealanders | 99.5 /100 | #59 | Exceptional 2.3% |
| Immigrants | Japan | 99.5 /100 | #60 | Exceptional 2.3% |
| Palestinians | 99.4 /100 | #61 | Exceptional 2.3% |
| Egyptians | 99.4 /100 | #62 | Exceptional 2.3% |
| Mongolians | 99.3 /100 | #63 | Exceptional 2.3% |
| Swedes | 99.3 /100 | #64 | Exceptional 2.3% |
| Brazilians | 99.3 /100 | #65 | Exceptional 2.3% |
| Immigrants | Argentina | 99.3 /100 | #66 | Exceptional 2.3% |
| South Africans | 99.3 /100 | #67 | Exceptional 2.3% |
| Immigrants | Zaire | 99.2 /100 | #68 | Exceptional 2.3% |
| Immigrants | Norway | 99.2 /100 | #69 | Exceptional 2.3% |
| Immigrants | Northern Europe | 99.2 /100 | #70 | Exceptional 2.3% |
Demographics Similar to Spanish American Indians by Self-Care Disability
In terms of self-care disability, the demographic groups most similar to Spanish American Indians are Assyrian/Chaldean/Syriac (2.8%, a difference of 0.16%), Immigrants from Dominica (2.8%, a difference of 0.17%), Chickasaw (2.9%, a difference of 0.22%), Menominee (2.8%, a difference of 0.29%), and Navajo (2.9%, a difference of 0.37%).
| Demographics | Rating | Rank | Self-Care Disability |
| Immigrants | Caribbean | 0.0 /100 | #312 | Tragic 2.8% |
| Spanish Americans | 0.0 /100 | #313 | Tragic 2.8% |
| Creek | 0.0 /100 | #314 | Tragic 2.8% |
| Immigrants | Cuba | 0.0 /100 | #315 | Tragic 2.8% |
| Menominee | 0.0 /100 | #316 | Tragic 2.8% |
| Immigrants | Dominica | 0.0 /100 | #317 | Tragic 2.8% |
| Assyrians/Chaldeans/Syriacs | 0.0 /100 | #318 | Tragic 2.8% |
| Spanish American Indians | 0.0 /100 | #319 | Tragic 2.9% |
| Chickasaw | 0.0 /100 | #320 | Tragic 2.9% |
| Navajo | 0.0 /100 | #321 | Tragic 2.9% |
| Comanche | 0.0 /100 | #322 | Tragic 2.9% |
| Seminole | 0.0 /100 | #323 | Tragic 2.9% |
| Cherokee | 0.0 /100 | #324 | Tragic 2.9% |
| Immigrants | Uzbekistan | 0.0 /100 | #325 | Tragic 2.9% |
| Paiute | 0.0 /100 | #326 | Tragic 2.9% |