Mongolian vs Spanish Self-Care Disability
COMPARE
Mongolian
Spanish
Self-Care Disability
Self-Care Disability Comparison
Mongolians
Spanish
2.3%
SELF-CARE DISABILITY
99.3/ 100
METRIC RATING
63rd/ 347
METRIC RANK
2.6%
SELF-CARE DISABILITY
0.8/ 100
METRIC RATING
242nd/ 347
METRIC RANK
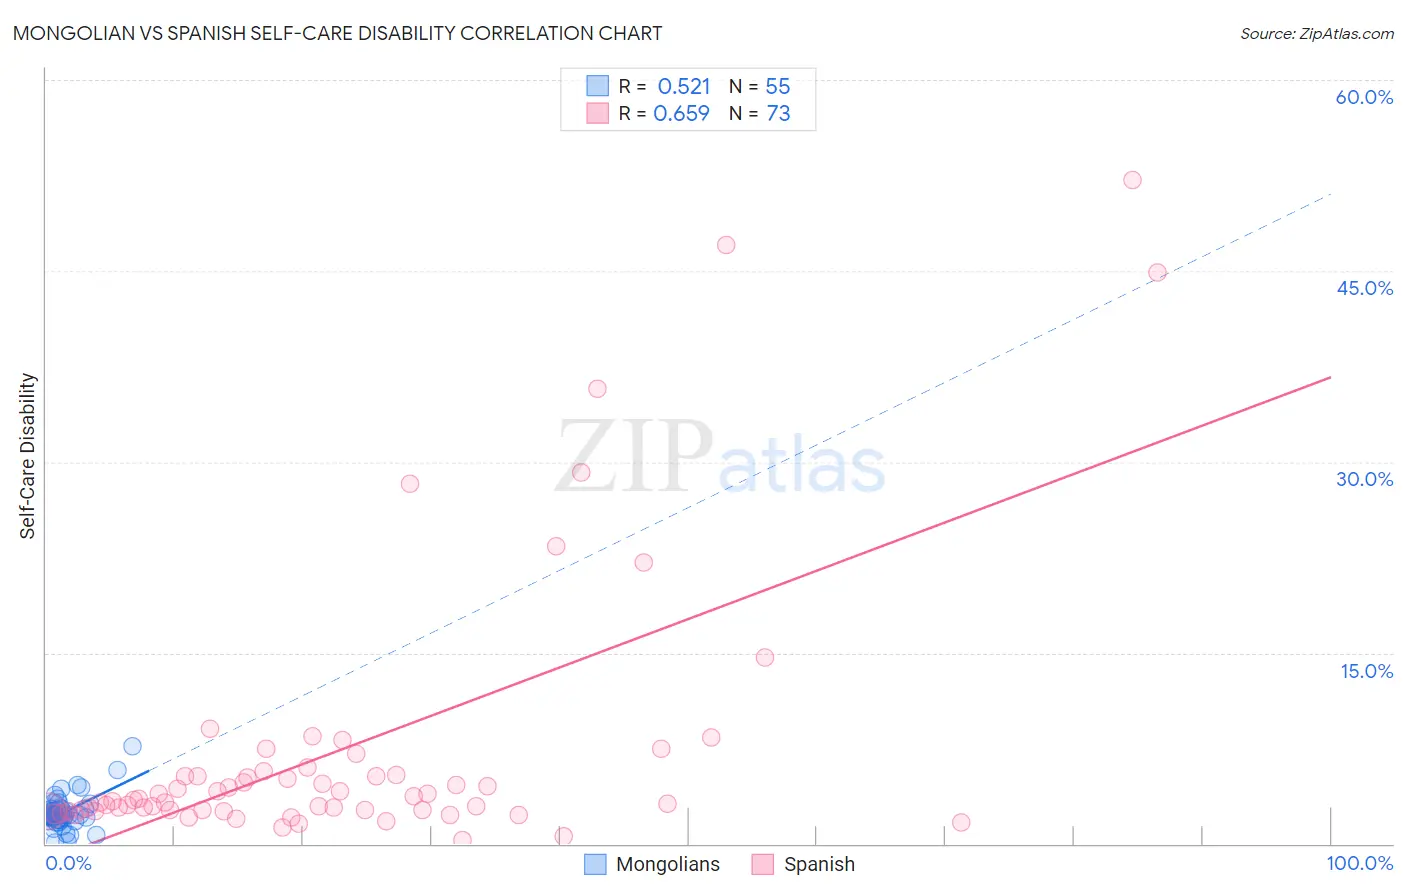
Mongolian vs Spanish Self-Care Disability Correlation Chart
The statistical analysis conducted on geographies consisting of 140,258,079 people shows a substantial positive correlation between the proportion of Mongolians and percentage of population with self-care disability in the United States with a correlation coefficient (R) of 0.521 and weighted average of 2.3%. Similarly, the statistical analysis conducted on geographies consisting of 421,620,595 people shows a significant positive correlation between the proportion of Spanish and percentage of population with self-care disability in the United States with a correlation coefficient (R) of 0.659 and weighted average of 2.6%, a difference of 12.4%.
Self-Care Disability Correlation Summary
| Measurement | Mongolian | Spanish |
| Minimum | 0.065% | 0.33% |
| Maximum | 7.7% | 52.1% |
| Range | 7.6% | 51.8% |
| Mean | 2.4% | 7.4% |
| Median | 2.2% | 3.4% |
| Interquartile 25% (IQ1) | 1.9% | 2.6% |
| Interquartile 75% (IQ3) | 2.8% | 5.5% |
| Interquartile Range (IQR) | 0.86% | 2.9% |
| Standard Deviation (Sample) | 1.2% | 10.7% |
| Standard Deviation (Population) | 1.2% | 10.7% |
Similar Demographics by Self-Care Disability
Demographics Similar to Mongolians by Self-Care Disability
In terms of self-care disability, the demographic groups most similar to Mongolians are Swedish (2.3%, a difference of 0.010%), Brazilian (2.3%, a difference of 0.070%), Egyptian (2.3%, a difference of 0.090%), Immigrants from Argentina (2.3%, a difference of 0.10%), and South African (2.3%, a difference of 0.13%).
| Demographics | Rating | Rank | Self-Care Disability |
| Immigrants | Eastern Asia | 99.6 /100 | #56 | Exceptional 2.3% |
| Immigrants | Belgium | 99.6 /100 | #57 | Exceptional 2.3% |
| Immigrants | Cameroon | 99.6 /100 | #58 | Exceptional 2.3% |
| New Zealanders | 99.5 /100 | #59 | Exceptional 2.3% |
| Immigrants | Japan | 99.5 /100 | #60 | Exceptional 2.3% |
| Palestinians | 99.4 /100 | #61 | Exceptional 2.3% |
| Egyptians | 99.4 /100 | #62 | Exceptional 2.3% |
| Mongolians | 99.3 /100 | #63 | Exceptional 2.3% |
| Swedes | 99.3 /100 | #64 | Exceptional 2.3% |
| Brazilians | 99.3 /100 | #65 | Exceptional 2.3% |
| Immigrants | Argentina | 99.3 /100 | #66 | Exceptional 2.3% |
| South Africans | 99.3 /100 | #67 | Exceptional 2.3% |
| Immigrants | Zaire | 99.2 /100 | #68 | Exceptional 2.3% |
| Immigrants | Norway | 99.2 /100 | #69 | Exceptional 2.3% |
| Immigrants | Northern Europe | 99.2 /100 | #70 | Exceptional 2.3% |
Demographics Similar to Spanish by Self-Care Disability
In terms of self-care disability, the demographic groups most similar to Spanish are Hawaiian (2.6%, a difference of 0.070%), Yuman (2.6%, a difference of 0.11%), Immigrants from Syria (2.6%, a difference of 0.23%), Immigrants from Western Asia (2.6%, a difference of 0.30%), and Cheyenne (2.6%, a difference of 0.32%).
| Demographics | Rating | Rank | Self-Care Disability |
| Bahamians | 2.0 /100 | #235 | Tragic 2.6% |
| Bermudans | 1.9 /100 | #236 | Tragic 2.6% |
| Immigrants | Senegal | 1.6 /100 | #237 | Tragic 2.6% |
| Senegalese | 1.3 /100 | #238 | Tragic 2.6% |
| Immigrants | Panama | 1.2 /100 | #239 | Tragic 2.6% |
| Marshallese | 1.2 /100 | #240 | Tragic 2.6% |
| Immigrants | Syria | 1.0 /100 | #241 | Tragic 2.6% |
| Spanish | 0.8 /100 | #242 | Tragic 2.6% |
| Hawaiians | 0.8 /100 | #243 | Tragic 2.6% |
| Yuman | 0.8 /100 | #244 | Tragic 2.6% |
| Immigrants | Western Asia | 0.6 /100 | #245 | Tragic 2.6% |
| Cheyenne | 0.6 /100 | #246 | Tragic 2.6% |
| Immigrants | Albania | 0.6 /100 | #247 | Tragic 2.6% |
| Nicaraguans | 0.6 /100 | #248 | Tragic 2.6% |
| Mexican American Indians | 0.5 /100 | #249 | Tragic 2.6% |