Inupiat vs Immigrants from Latin America Cognitive Disability
COMPARE
Inupiat
Immigrants from Latin America
Cognitive Disability
Cognitive Disability Comparison
Inupiat
Immigrants from Latin America
16.9%
COGNITIVE DISABILITY
96.5/ 100
METRIC RATING
116th/ 347
METRIC RANK
17.6%
COGNITIVE DISABILITY
9.7/ 100
METRIC RATING
207th/ 347
METRIC RANK
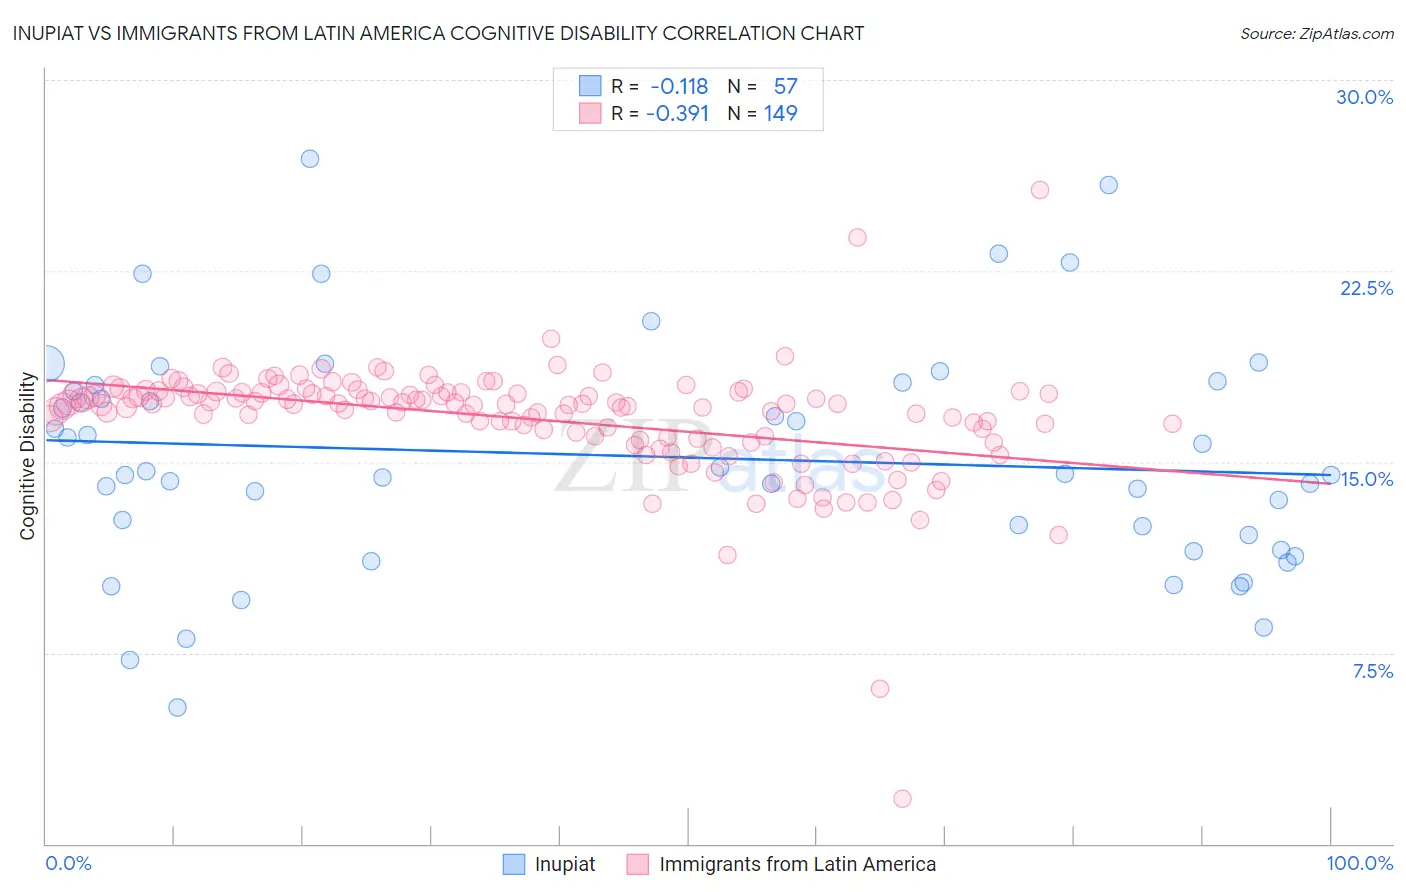
Inupiat vs Immigrants from Latin America Cognitive Disability Correlation Chart
The statistical analysis conducted on geographies consisting of 96,337,062 people shows a poor negative correlation between the proportion of Inupiat and percentage of population with cognitive disability in the United States with a correlation coefficient (R) of -0.118 and weighted average of 16.9%. Similarly, the statistical analysis conducted on geographies consisting of 558,464,403 people shows a mild negative correlation between the proportion of Immigrants from Latin America and percentage of population with cognitive disability in the United States with a correlation coefficient (R) of -0.391 and weighted average of 17.6%, a difference of 4.0%.
Cognitive Disability Correlation Summary
| Measurement | Inupiat | Immigrants from Latin America |
| Minimum | 5.4% | 1.8% |
| Maximum | 26.9% | 25.7% |
| Range | 21.6% | 23.9% |
| Mean | 15.2% | 16.7% |
| Median | 14.5% | 17.3% |
| Interquartile 25% (IQ1) | 11.8% | 16.0% |
| Interquartile 75% (IQ3) | 18.1% | 17.7% |
| Interquartile Range (IQR) | 6.2% | 1.7% |
| Standard Deviation (Sample) | 4.5% | 2.3% |
| Standard Deviation (Population) | 4.5% | 2.3% |
Similar Demographics by Cognitive Disability
Demographics Similar to Inupiat by Cognitive Disability
In terms of cognitive disability, the demographic groups most similar to Inupiat are Immigrants from Japan (16.9%, a difference of 0.050%), Immigrants from Denmark (16.9%, a difference of 0.060%), Yup'ik (16.9%, a difference of 0.10%), Immigrants from Sri Lanka (16.8%, a difference of 0.15%), and Korean (16.8%, a difference of 0.15%).
| Demographics | Rating | Rank | Cognitive Disability |
| Albanians | 97.3 /100 | #109 | Exceptional 16.8% |
| Arapaho | 97.3 /100 | #110 | Exceptional 16.8% |
| Uruguayans | 97.2 /100 | #111 | Exceptional 16.8% |
| Indians (Asian) | 97.2 /100 | #112 | Exceptional 16.8% |
| Immigrants | Sri Lanka | 97.1 /100 | #113 | Exceptional 16.8% |
| Koreans | 97.1 /100 | #114 | Exceptional 16.8% |
| Yup'ik | 96.9 /100 | #115 | Exceptional 16.9% |
| Inupiat | 96.5 /100 | #116 | Exceptional 16.9% |
| Immigrants | Japan | 96.2 /100 | #117 | Exceptional 16.9% |
| Immigrants | Denmark | 96.2 /100 | #118 | Exceptional 16.9% |
| South Africans | 95.5 /100 | #119 | Exceptional 16.9% |
| Scottish | 95.0 /100 | #120 | Exceptional 16.9% |
| Immigrants | China | 94.9 /100 | #121 | Exceptional 16.9% |
| Immigrants | Western Europe | 94.8 /100 | #122 | Exceptional 16.9% |
| Portuguese | 94.7 /100 | #123 | Exceptional 16.9% |
Demographics Similar to Immigrants from Latin America by Cognitive Disability
In terms of cognitive disability, the demographic groups most similar to Immigrants from Latin America are Immigrants from Cameroon (17.6%, a difference of 0.030%), Alaska Native (17.5%, a difference of 0.050%), Immigrants from Trinidad and Tobago (17.6%, a difference of 0.080%), Puget Sound Salish (17.5%, a difference of 0.090%), and Immigrants from Caribbean (17.5%, a difference of 0.10%).
| Demographics | Rating | Rank | Cognitive Disability |
| Haitians | 14.1 /100 | #200 | Poor 17.5% |
| South American Indians | 13.0 /100 | #201 | Poor 17.5% |
| Immigrants | Morocco | 12.0 /100 | #202 | Poor 17.5% |
| Immigrants | Caribbean | 11.0 /100 | #203 | Poor 17.5% |
| Immigrants | Zimbabwe | 11.0 /100 | #204 | Poor 17.5% |
| Puget Sound Salish | 10.9 /100 | #205 | Poor 17.5% |
| Alaska Natives | 10.4 /100 | #206 | Poor 17.5% |
| Immigrants | Latin America | 9.7 /100 | #207 | Tragic 17.6% |
| Immigrants | Cameroon | 9.3 /100 | #208 | Tragic 17.6% |
| Immigrants | Trinidad and Tobago | 8.7 /100 | #209 | Tragic 17.6% |
| Immigrants | Jamaica | 8.5 /100 | #210 | Tragic 17.6% |
| Taiwanese | 7.7 /100 | #211 | Tragic 17.6% |
| Immigrants | Oceania | 7.3 /100 | #212 | Tragic 17.6% |
| Hawaiians | 7.2 /100 | #213 | Tragic 17.6% |
| Immigrants | El Salvador | 7.0 /100 | #214 | Tragic 17.6% |