German Russian vs Immigrants from Latin America Cognitive Disability
COMPARE
German Russian
Immigrants from Latin America
Cognitive Disability
Cognitive Disability Comparison
German Russians
Immigrants from Latin America
18.2%
COGNITIVE DISABILITY
0.0/ 100
METRIC RATING
295th/ 347
METRIC RANK
17.6%
COGNITIVE DISABILITY
9.7/ 100
METRIC RATING
207th/ 347
METRIC RANK
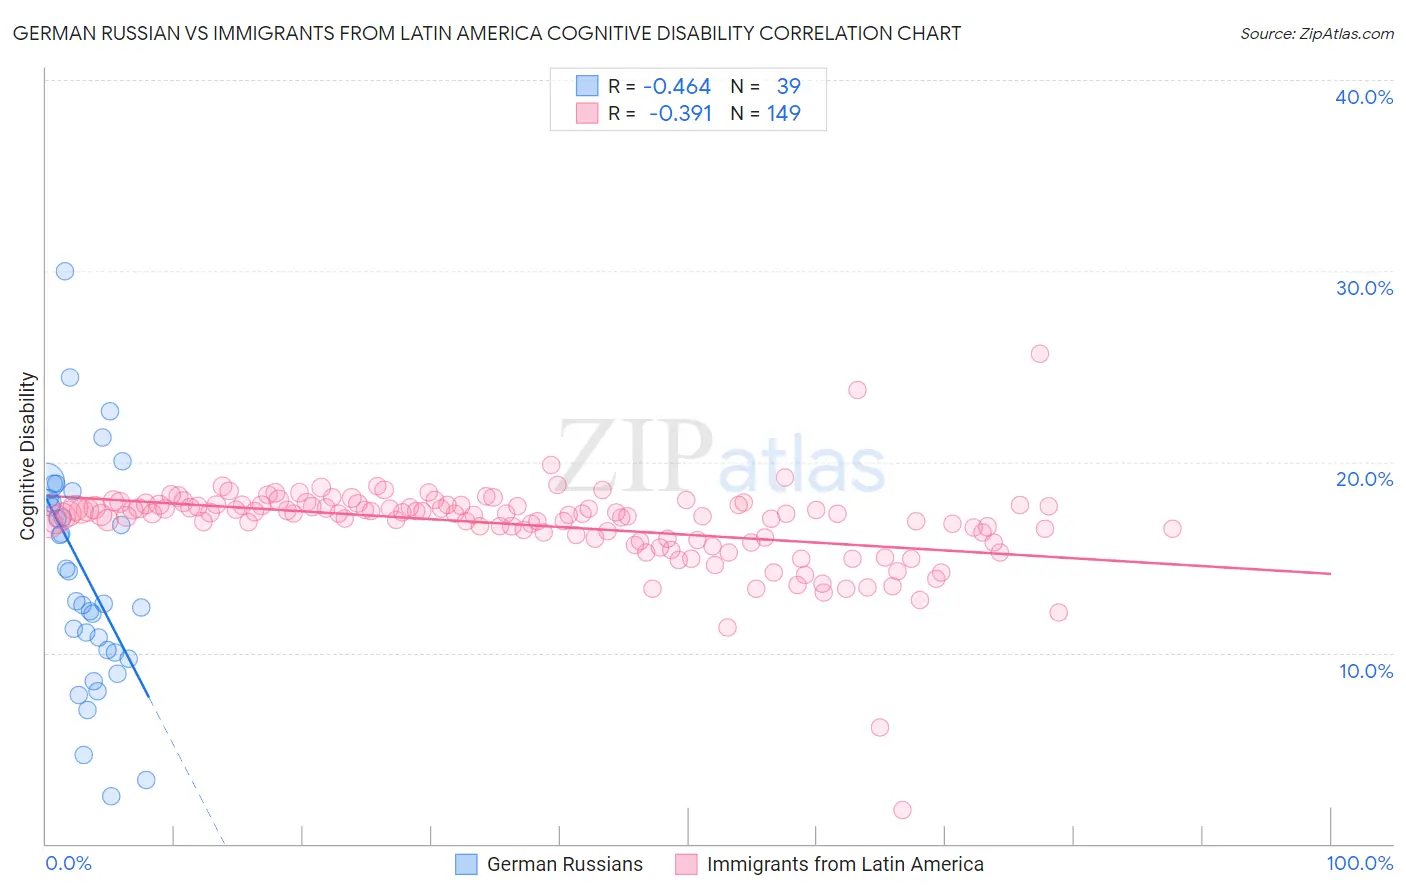
German Russian vs Immigrants from Latin America Cognitive Disability Correlation Chart
The statistical analysis conducted on geographies consisting of 96,458,648 people shows a moderate negative correlation between the proportion of German Russians and percentage of population with cognitive disability in the United States with a correlation coefficient (R) of -0.464 and weighted average of 18.2%. Similarly, the statistical analysis conducted on geographies consisting of 558,464,403 people shows a mild negative correlation between the proportion of Immigrants from Latin America and percentage of population with cognitive disability in the United States with a correlation coefficient (R) of -0.391 and weighted average of 17.6%, a difference of 3.9%.
Cognitive Disability Correlation Summary
| Measurement | German Russian | Immigrants from Latin America |
| Minimum | 2.5% | 1.8% |
| Maximum | 30.0% | 25.7% |
| Range | 27.6% | 23.9% |
| Mean | 14.0% | 16.7% |
| Median | 12.7% | 17.3% |
| Interquartile 25% (IQ1) | 10.0% | 16.0% |
| Interquartile 75% (IQ3) | 18.1% | 17.7% |
| Interquartile Range (IQR) | 8.0% | 1.7% |
| Standard Deviation (Sample) | 5.9% | 2.3% |
| Standard Deviation (Population) | 5.8% | 2.3% |
Similar Demographics by Cognitive Disability
Demographics Similar to German Russians by Cognitive Disability
In terms of cognitive disability, the demographic groups most similar to German Russians are Immigrants from Burma/Myanmar (18.2%, a difference of 0.020%), British West Indian (18.2%, a difference of 0.17%), Blackfeet (18.3%, a difference of 0.17%), Japanese (18.3%, a difference of 0.17%), and Ghanaian (18.3%, a difference of 0.20%).
| Demographics | Rating | Rank | Cognitive Disability |
| Immigrants | West Indies | 0.1 /100 | #288 | Tragic 18.1% |
| Natives/Alaskans | 0.1 /100 | #289 | Tragic 18.1% |
| Immigrants | Africa | 0.1 /100 | #290 | Tragic 18.1% |
| Ottawa | 0.1 /100 | #291 | Tragic 18.2% |
| Iroquois | 0.1 /100 | #292 | Tragic 18.2% |
| Central American Indians | 0.1 /100 | #293 | Tragic 18.2% |
| British West Indians | 0.1 /100 | #294 | Tragic 18.2% |
| German Russians | 0.0 /100 | #295 | Tragic 18.2% |
| Immigrants | Burma/Myanmar | 0.0 /100 | #296 | Tragic 18.2% |
| Blackfeet | 0.0 /100 | #297 | Tragic 18.3% |
| Japanese | 0.0 /100 | #298 | Tragic 18.3% |
| Ghanaians | 0.0 /100 | #299 | Tragic 18.3% |
| Creek | 0.0 /100 | #300 | Tragic 18.3% |
| Immigrants | Ghana | 0.0 /100 | #301 | Tragic 18.3% |
| Barbadians | 0.0 /100 | #302 | Tragic 18.3% |
Demographics Similar to Immigrants from Latin America by Cognitive Disability
In terms of cognitive disability, the demographic groups most similar to Immigrants from Latin America are Immigrants from Cameroon (17.6%, a difference of 0.030%), Alaska Native (17.5%, a difference of 0.050%), Immigrants from Trinidad and Tobago (17.6%, a difference of 0.080%), Puget Sound Salish (17.5%, a difference of 0.090%), and Immigrants from Caribbean (17.5%, a difference of 0.10%).
| Demographics | Rating | Rank | Cognitive Disability |
| Haitians | 14.1 /100 | #200 | Poor 17.5% |
| South American Indians | 13.0 /100 | #201 | Poor 17.5% |
| Immigrants | Morocco | 12.0 /100 | #202 | Poor 17.5% |
| Immigrants | Caribbean | 11.0 /100 | #203 | Poor 17.5% |
| Immigrants | Zimbabwe | 11.0 /100 | #204 | Poor 17.5% |
| Puget Sound Salish | 10.9 /100 | #205 | Poor 17.5% |
| Alaska Natives | 10.4 /100 | #206 | Poor 17.5% |
| Immigrants | Latin America | 9.7 /100 | #207 | Tragic 17.6% |
| Immigrants | Cameroon | 9.3 /100 | #208 | Tragic 17.6% |
| Immigrants | Trinidad and Tobago | 8.7 /100 | #209 | Tragic 17.6% |
| Immigrants | Jamaica | 8.5 /100 | #210 | Tragic 17.6% |
| Taiwanese | 7.7 /100 | #211 | Tragic 17.6% |
| Immigrants | Oceania | 7.3 /100 | #212 | Tragic 17.6% |
| Hawaiians | 7.2 /100 | #213 | Tragic 17.6% |
| Immigrants | El Salvador | 7.0 /100 | #214 | Tragic 17.6% |