Mongolian vs Lebanese Hearing Disability
COMPARE
Mongolian
Lebanese
Hearing Disability
Hearing Disability Comparison
Mongolians
Lebanese
2.7%
HEARING DISABILITY
97.4/ 100
METRIC RATING
78th/ 347
METRIC RANK
3.2%
HEARING DISABILITY
5.0/ 100
METRIC RATING
226th/ 347
METRIC RANK
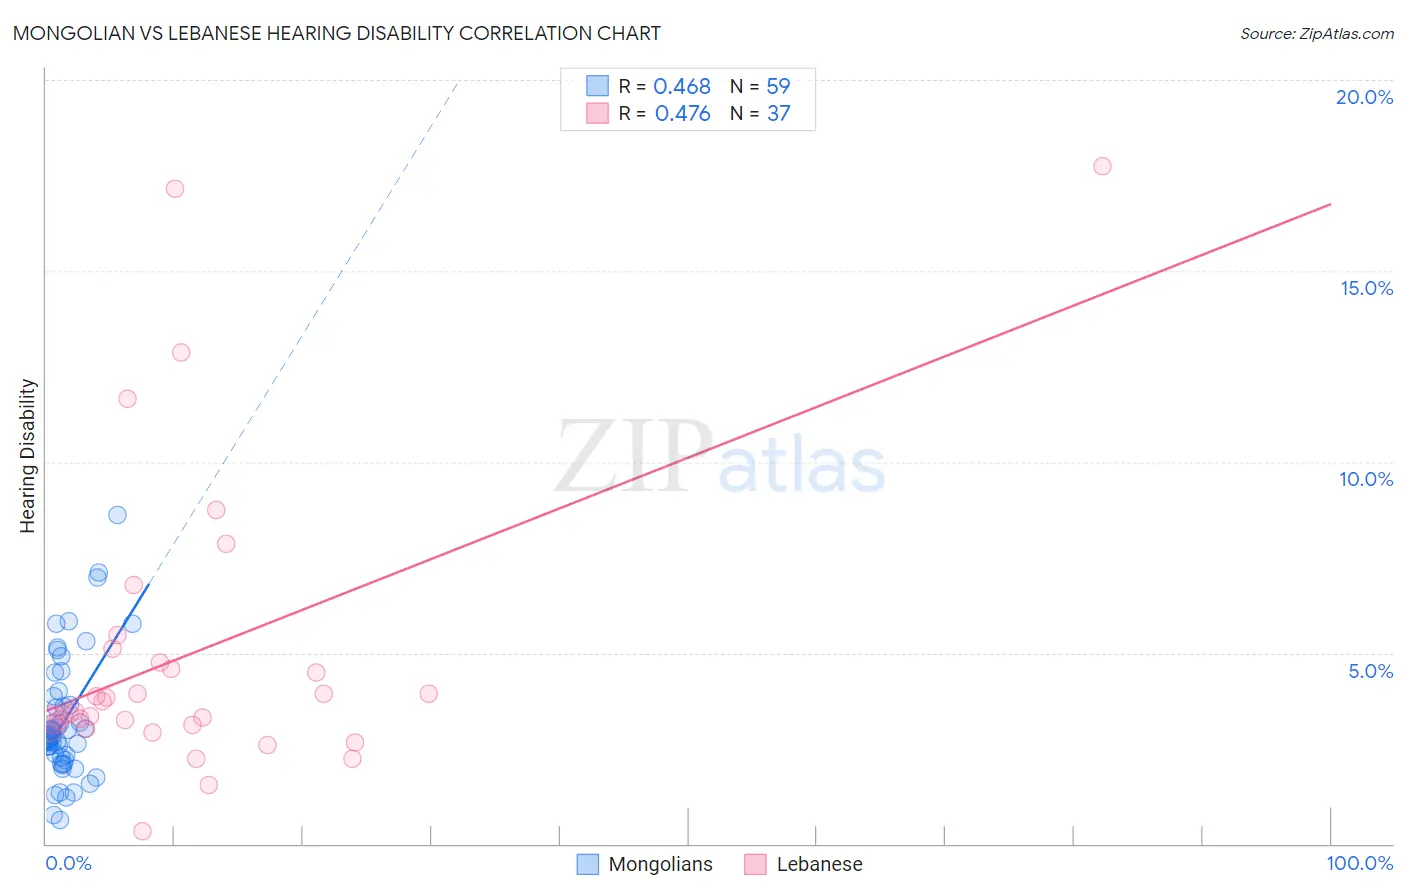
Mongolian vs Lebanese Hearing Disability Correlation Chart
The statistical analysis conducted on geographies consisting of 140,352,505 people shows a moderate positive correlation between the proportion of Mongolians and percentage of population with hearing disability in the United States with a correlation coefficient (R) of 0.468 and weighted average of 2.7%. Similarly, the statistical analysis conducted on geographies consisting of 401,493,679 people shows a moderate positive correlation between the proportion of Lebanese and percentage of population with hearing disability in the United States with a correlation coefficient (R) of 0.476 and weighted average of 3.2%, a difference of 16.9%.
Hearing Disability Correlation Summary
| Measurement | Mongolian | Lebanese |
| Minimum | 0.63% | 0.31% |
| Maximum | 8.6% | 17.8% |
| Range | 8.0% | 17.4% |
| Mean | 3.2% | 5.0% |
| Median | 2.8% | 3.5% |
| Interquartile 25% (IQ1) | 2.3% | 3.1% |
| Interquartile 75% (IQ3) | 3.6% | 4.9% |
| Interquartile Range (IQR) | 1.4% | 1.8% |
| Standard Deviation (Sample) | 1.6% | 3.9% |
| Standard Deviation (Population) | 1.6% | 3.9% |
Similar Demographics by Hearing Disability
Demographics Similar to Mongolians by Hearing Disability
In terms of hearing disability, the demographic groups most similar to Mongolians are Colombian (2.7%, a difference of 0.020%), Immigrants from Malaysia (2.7%, a difference of 0.040%), Immigrants from Saudi Arabia (2.7%, a difference of 0.070%), Asian (2.7%, a difference of 0.070%), and Immigrants from Korea (2.7%, a difference of 0.090%).
| Demographics | Rating | Rank | Hearing Disability |
| Central Americans | 97.7 /100 | #71 | Exceptional 2.7% |
| Afghans | 97.6 /100 | #72 | Exceptional 2.7% |
| Argentineans | 97.5 /100 | #73 | Exceptional 2.7% |
| Immigrants | Korea | 97.5 /100 | #74 | Exceptional 2.7% |
| Immigrants | Saudi Arabia | 97.5 /100 | #75 | Exceptional 2.7% |
| Asians | 97.5 /100 | #76 | Exceptional 2.7% |
| Immigrants | Malaysia | 97.5 /100 | #77 | Exceptional 2.7% |
| Mongolians | 97.4 /100 | #78 | Exceptional 2.7% |
| Colombians | 97.4 /100 | #79 | Exceptional 2.7% |
| Immigrants | Asia | 97.2 /100 | #80 | Exceptional 2.7% |
| Immigrants | Uruguay | 97.2 /100 | #81 | Exceptional 2.7% |
| Immigrants | Armenia | 97.2 /100 | #82 | Exceptional 2.7% |
| Immigrants | Cuba | 97.2 /100 | #83 | Exceptional 2.7% |
| Immigrants | Argentina | 97.0 /100 | #84 | Exceptional 2.8% |
| Immigrants | Northern Africa | 96.9 /100 | #85 | Exceptional 2.8% |
Demographics Similar to Lebanese by Hearing Disability
In terms of hearing disability, the demographic groups most similar to Lebanese are Latvian (3.2%, a difference of 0.040%), Icelander (3.2%, a difference of 0.090%), Bhutanese (3.2%, a difference of 0.18%), Mexican (3.2%, a difference of 0.25%), and Immigrants from Portugal (3.2%, a difference of 0.38%).
| Demographics | Rating | Rank | Hearing Disability |
| New Zealanders | 6.8 /100 | #219 | Tragic 3.2% |
| Malaysians | 6.6 /100 | #220 | Tragic 3.2% |
| Immigrants | Laos | 6.6 /100 | #221 | Tragic 3.2% |
| Immigrants | Oceania | 6.5 /100 | #222 | Tragic 3.2% |
| Mexicans | 5.6 /100 | #223 | Tragic 3.2% |
| Icelanders | 5.2 /100 | #224 | Tragic 3.2% |
| Latvians | 5.1 /100 | #225 | Tragic 3.2% |
| Lebanese | 5.0 /100 | #226 | Tragic 3.2% |
| Bhutanese | 4.6 /100 | #227 | Tragic 3.2% |
| Immigrants | Portugal | 4.3 /100 | #228 | Tragic 3.2% |
| Maltese | 4.1 /100 | #229 | Tragic 3.2% |
| Greeks | 3.2 /100 | #230 | Tragic 3.2% |
| Luxembourgers | 2.9 /100 | #231 | Tragic 3.2% |
| Ukrainians | 2.9 /100 | #232 | Tragic 3.2% |
| Estonians | 2.4 /100 | #233 | Tragic 3.3% |