Mongolian vs Immigrants from Eastern Europe In Labor Force | Age 20-24
COMPARE
Mongolian
Immigrants from Eastern Europe
In Labor Force | Age 20-24
In Labor Force | Age 20-24 Comparison
Mongolians
Immigrants from Eastern Europe
73.3%
IN LABOR FORCE | AGE 20-24
0.2/ 100
METRIC RATING
276th/ 347
METRIC RANK
74.9%
IN LABOR FORCE | AGE 20-24
33.8/ 100
METRIC RATING
186th/ 347
METRIC RANK
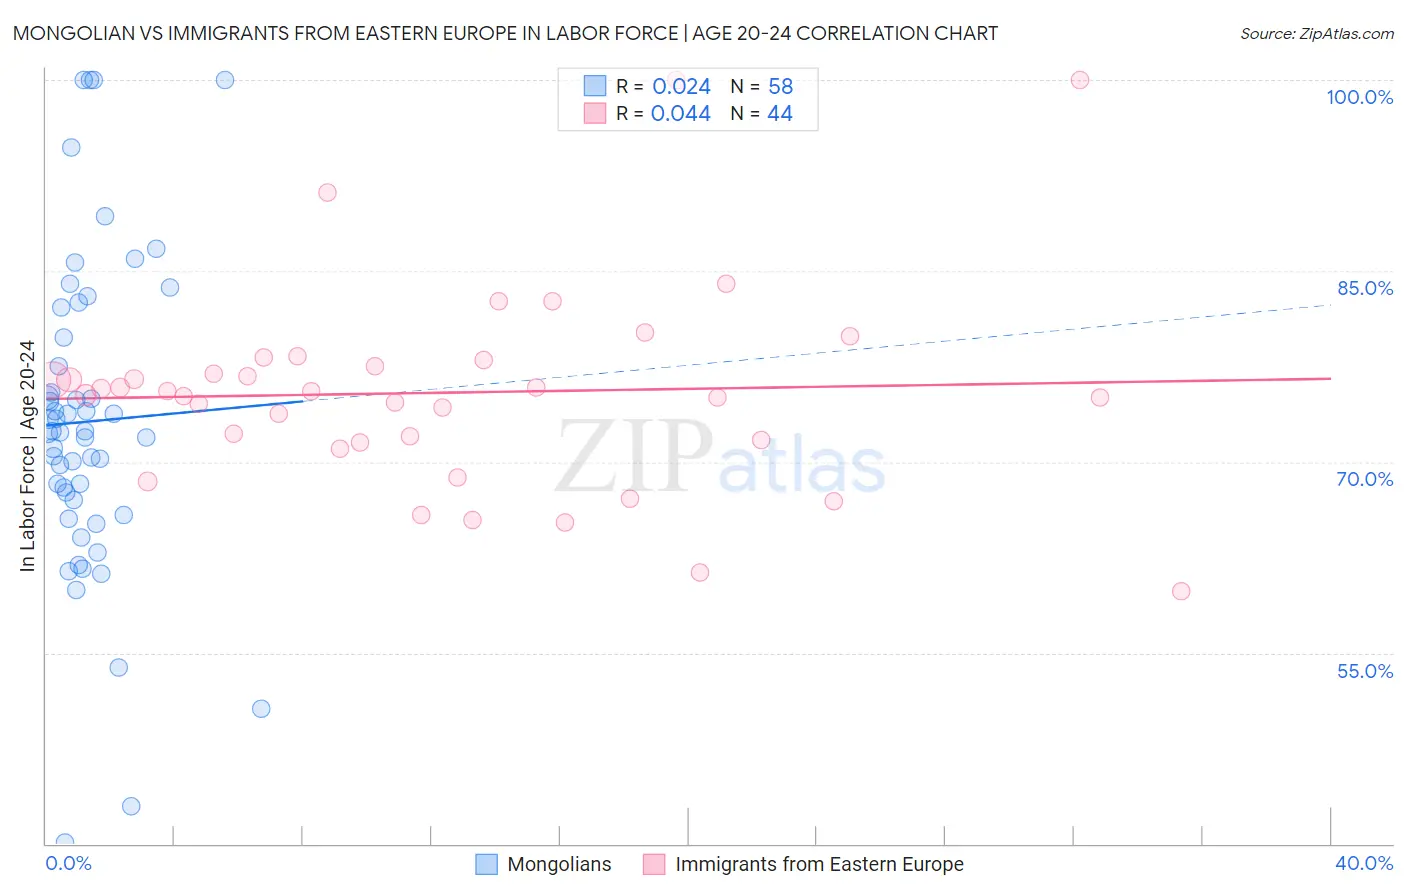
Mongolian vs Immigrants from Eastern Europe In Labor Force | Age 20-24 Correlation Chart
The statistical analysis conducted on geographies consisting of 140,358,526 people shows no correlation between the proportion of Mongolians and labor force participation rate among population between the ages 20 and 24 in the United States with a correlation coefficient (R) of 0.024 and weighted average of 73.3%. Similarly, the statistical analysis conducted on geographies consisting of 475,471,166 people shows no correlation between the proportion of Immigrants from Eastern Europe and labor force participation rate among population between the ages 20 and 24 in the United States with a correlation coefficient (R) of 0.044 and weighted average of 74.9%, a difference of 2.1%.
In Labor Force | Age 20-24 Correlation Summary
| Measurement | Mongolian | Immigrants from Eastern Europe |
| Minimum | 40.1% | 59.8% |
| Maximum | 100.0% | 100.0% |
| Range | 59.9% | 40.2% |
| Mean | 73.2% | 75.4% |
| Median | 72.4% | 75.4% |
| Interquartile 25% (IQ1) | 67.0% | 71.6% |
| Interquartile 75% (IQ3) | 79.7% | 77.8% |
| Interquartile Range (IQR) | 12.8% | 6.1% |
| Standard Deviation (Sample) | 12.5% | 8.0% |
| Standard Deviation (Population) | 12.4% | 7.9% |
Similar Demographics by In Labor Force | Age 20-24
Demographics Similar to Mongolians by In Labor Force | Age 20-24
In terms of in labor force | age 20-24, the demographic groups most similar to Mongolians are Immigrants from South America (73.3%, a difference of 0.010%), Immigrants from Malaysia (73.3%, a difference of 0.010%), Cypriot (73.3%, a difference of 0.030%), Venezuelan (73.3%, a difference of 0.030%), and Immigrants from Colombia (73.4%, a difference of 0.070%).
| Demographics | Rating | Rank | In Labor Force | Age 20-24 |
| Colombians | 0.3 /100 | #269 | Tragic 73.5% |
| Immigrants | Russia | 0.3 /100 | #270 | Tragic 73.5% |
| Immigrants | Indonesia | 0.3 /100 | #271 | Tragic 73.4% |
| Belizeans | 0.3 /100 | #272 | Tragic 73.4% |
| Cheyenne | 0.2 /100 | #273 | Tragic 73.4% |
| Immigrants | Colombia | 0.2 /100 | #274 | Tragic 73.4% |
| Immigrants | South America | 0.2 /100 | #275 | Tragic 73.3% |
| Mongolians | 0.2 /100 | #276 | Tragic 73.3% |
| Immigrants | Malaysia | 0.2 /100 | #277 | Tragic 73.3% |
| Cypriots | 0.2 /100 | #278 | Tragic 73.3% |
| Venezuelans | 0.2 /100 | #279 | Tragic 73.3% |
| Bahamians | 0.1 /100 | #280 | Tragic 73.3% |
| Immigrants | Venezuela | 0.1 /100 | #281 | Tragic 73.2% |
| Immigrants | Spain | 0.1 /100 | #282 | Tragic 73.2% |
| Immigrants | Bahamas | 0.1 /100 | #283 | Tragic 73.2% |
Demographics Similar to Immigrants from Eastern Europe by In Labor Force | Age 20-24
In terms of in labor force | age 20-24, the demographic groups most similar to Immigrants from Eastern Europe are Immigrants from Honduras (74.9%, a difference of 0.010%), Immigrants from Hungary (74.9%, a difference of 0.020%), Sri Lankan (74.9%, a difference of 0.020%), Honduran (74.8%, a difference of 0.020%), and Immigrants from Northern Europe (74.8%, a difference of 0.020%).
| Demographics | Rating | Rank | In Labor Force | Age 20-24 |
| Immigrants | Latvia | 44.1 /100 | #179 | Average 75.0% |
| Immigrants | Czechoslovakia | 44.0 /100 | #180 | Average 75.0% |
| Africans | 42.5 /100 | #181 | Average 75.0% |
| Immigrants | South Africa | 36.9 /100 | #182 | Fair 74.9% |
| Immigrants | Costa Rica | 36.7 /100 | #183 | Fair 74.9% |
| Immigrants | Hungary | 35.0 /100 | #184 | Fair 74.9% |
| Sri Lankans | 34.9 /100 | #185 | Fair 74.9% |
| Immigrants | Eastern Europe | 33.8 /100 | #186 | Fair 74.9% |
| Immigrants | Honduras | 33.5 /100 | #187 | Fair 74.9% |
| Hondurans | 32.7 /100 | #188 | Fair 74.8% |
| Immigrants | Northern Europe | 32.6 /100 | #189 | Fair 74.8% |
| Russians | 32.2 /100 | #190 | Fair 74.8% |
| Senegalese | 28.1 /100 | #191 | Fair 74.8% |
| Immigrants | Europe | 27.5 /100 | #192 | Fair 74.8% |
| Alsatians | 27.1 /100 | #193 | Fair 74.8% |