Mexican vs Immigrants from Honduras Householder Income Ages 25 - 44 years
COMPARE
Mexican
Immigrants from Honduras
Householder Income Ages 25 - 44 years
Householder Income Ages 25 - 44 years Comparison
Mexicans
Immigrants from Honduras
$80,427
HOUSEHOLDER INCOME AGES 25 - 44 YEARS
0.0/ 100
METRIC RATING
303rd/ 347
METRIC RANK
$77,328
HOUSEHOLDER INCOME AGES 25 - 44 YEARS
0.0/ 100
METRIC RATING
323rd/ 347
METRIC RANK
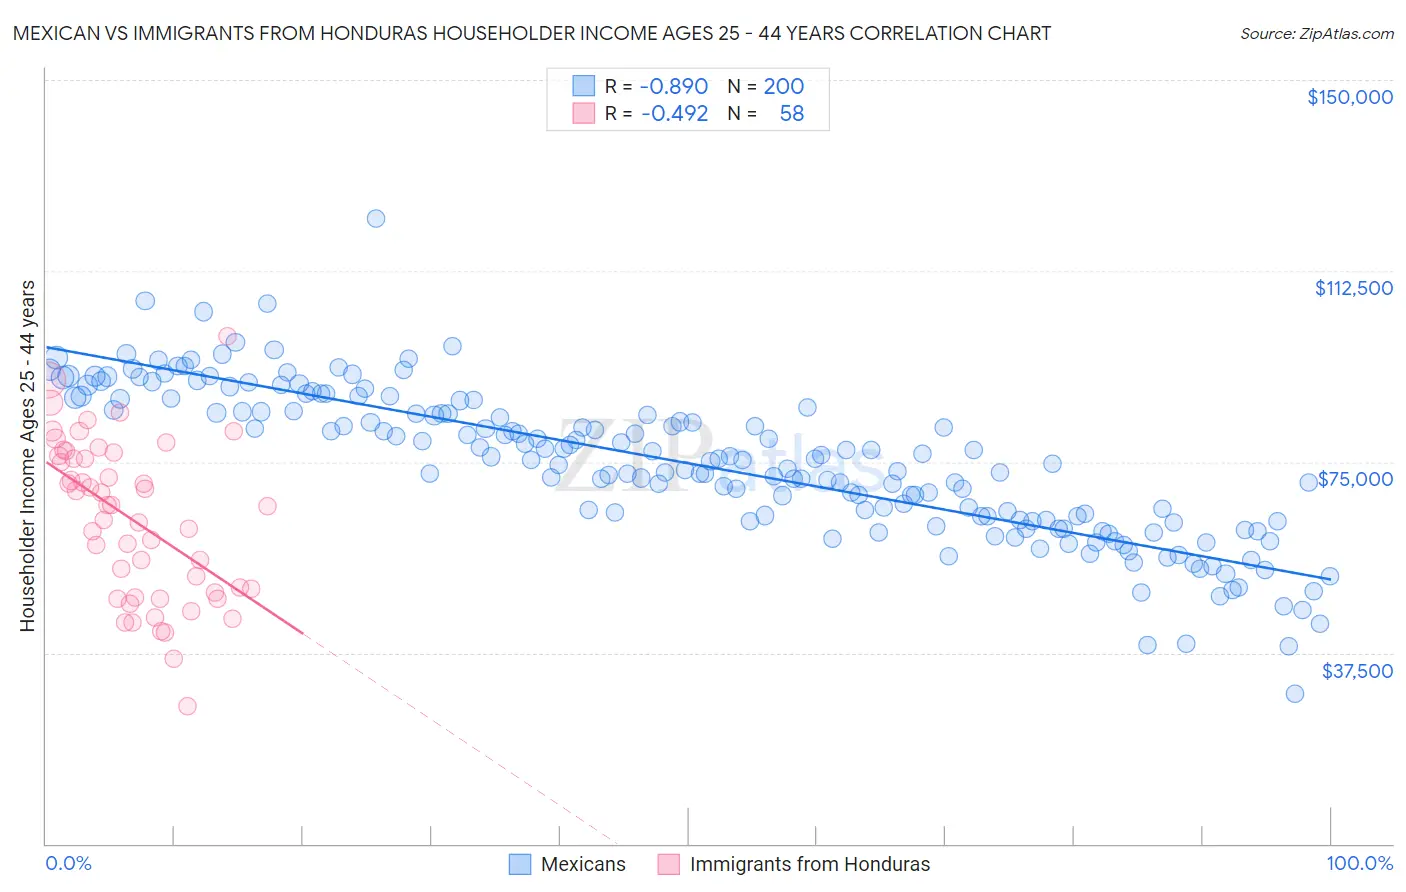
Mexican vs Immigrants from Honduras Householder Income Ages 25 - 44 years Correlation Chart
The statistical analysis conducted on geographies consisting of 559,949,766 people shows a very strong negative correlation between the proportion of Mexicans and household income with householder between the ages 25 and 44 in the United States with a correlation coefficient (R) of -0.890 and weighted average of $80,427. Similarly, the statistical analysis conducted on geographies consisting of 321,952,844 people shows a moderate negative correlation between the proportion of Immigrants from Honduras and household income with householder between the ages 25 and 44 in the United States with a correlation coefficient (R) of -0.492 and weighted average of $77,328, a difference of 4.0%.
Householder Income Ages 25 - 44 years Correlation Summary
| Measurement | Mexican | Immigrants from Honduras |
| Minimum | $29,496 | $26,956 |
| Maximum | $122,837 | $99,657 |
| Range | $93,341 | $72,701 |
| Mean | $74,718 | $63,676 |
| Median | $75,510 | $66,366 |
| Interquartile 25% (IQ1) | $63,535 | $49,234 |
| Interquartile 75% (IQ3) | $85,434 | $76,183 |
| Interquartile Range (IQR) | $21,899 | $26,949 |
| Standard Deviation (Sample) | $14,848 | $15,519 |
| Standard Deviation (Population) | $14,811 | $15,385 |
Demographics Similar to Mexicans and Immigrants from Honduras by Householder Income Ages 25 - 44 years
In terms of householder income ages 25 - 44 years, the demographic groups most similar to Mexicans are Immigrants from Caribbean ($80,326, a difference of 0.13%), Immigrants from Dominican Republic ($80,319, a difference of 0.13%), Apache ($80,260, a difference of 0.21%), Haitian ($80,055, a difference of 0.47%), and Immigrants from Central America ($80,012, a difference of 0.52%). Similarly, the demographic groups most similar to Immigrants from Honduras are Chickasaw ($77,929, a difference of 0.78%), Immigrants from Zaire ($78,045, a difference of 0.93%), Choctaw ($78,168, a difference of 1.1%), Honduran ($78,540, a difference of 1.6%), and Immigrants from Mexico ($78,809, a difference of 1.9%).
| Demographics | Rating | Rank | Householder Income Ages 25 - 44 years |
| Mexicans | 0.0 /100 | #303 | Tragic $80,427 |
| Immigrants | Caribbean | 0.0 /100 | #304 | Tragic $80,326 |
| Immigrants | Dominican Republic | 0.0 /100 | #305 | Tragic $80,319 |
| Apache | 0.0 /100 | #306 | Tragic $80,260 |
| Haitians | 0.0 /100 | #307 | Tragic $80,055 |
| Immigrants | Central America | 0.0 /100 | #308 | Tragic $80,012 |
| Chippewa | 0.0 /100 | #309 | Tragic $80,005 |
| Fijians | 0.0 /100 | #310 | Tragic $79,956 |
| Indonesians | 0.0 /100 | #311 | Tragic $79,543 |
| Immigrants | Haiti | 0.0 /100 | #312 | Tragic $79,391 |
| Menominee | 0.0 /100 | #313 | Tragic $79,358 |
| Cheyenne | 0.0 /100 | #314 | Tragic $79,152 |
| Ottawa | 0.0 /100 | #315 | Tragic $79,012 |
| Africans | 0.0 /100 | #316 | Tragic $78,986 |
| U.S. Virgin Islanders | 0.0 /100 | #317 | Tragic $78,911 |
| Immigrants | Mexico | 0.0 /100 | #318 | Tragic $78,809 |
| Hondurans | 0.0 /100 | #319 | Tragic $78,540 |
| Choctaw | 0.0 /100 | #320 | Tragic $78,168 |
| Immigrants | Zaire | 0.0 /100 | #321 | Tragic $78,045 |
| Chickasaw | 0.0 /100 | #322 | Tragic $77,929 |
| Immigrants | Honduras | 0.0 /100 | #323 | Tragic $77,328 |