Central American Indian vs Immigrants from Caribbean Cognitive Disability
COMPARE
Central American Indian
Immigrants from Caribbean
Cognitive Disability
Cognitive Disability Comparison
Central American Indians
Immigrants from Caribbean
18.2%
COGNITIVE DISABILITY
0.1/ 100
METRIC RATING
293rd/ 347
METRIC RANK
17.5%
COGNITIVE DISABILITY
11.0/ 100
METRIC RATING
203rd/ 347
METRIC RANK
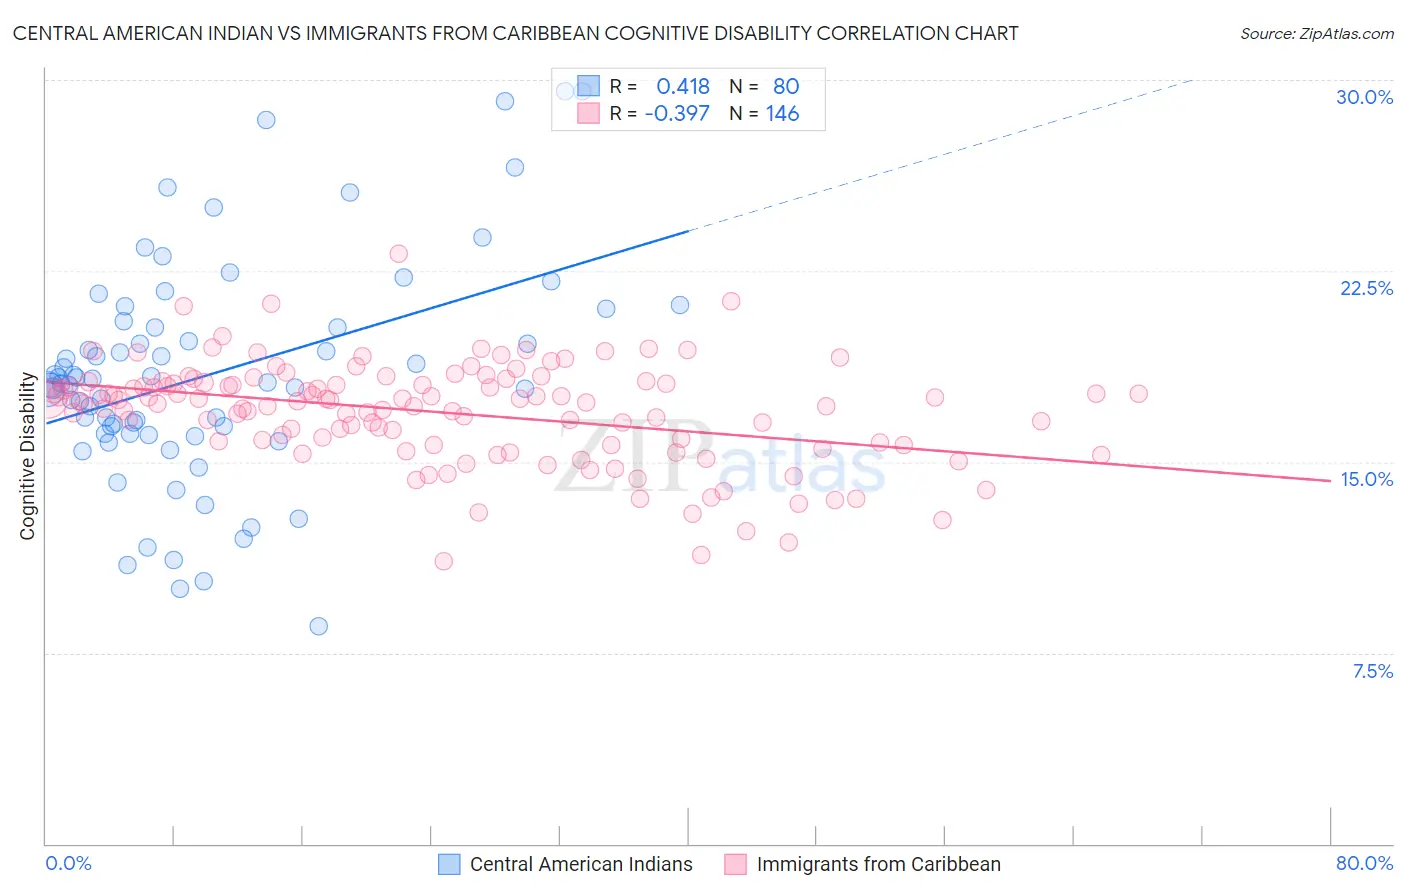
Central American Indian vs Immigrants from Caribbean Cognitive Disability Correlation Chart
The statistical analysis conducted on geographies consisting of 326,115,408 people shows a moderate positive correlation between the proportion of Central American Indians and percentage of population with cognitive disability in the United States with a correlation coefficient (R) of 0.418 and weighted average of 18.2%. Similarly, the statistical analysis conducted on geographies consisting of 449,949,141 people shows a mild negative correlation between the proportion of Immigrants from Caribbean and percentage of population with cognitive disability in the United States with a correlation coefficient (R) of -0.397 and weighted average of 17.5%, a difference of 3.7%.
Cognitive Disability Correlation Summary
| Measurement | Central American Indian | Immigrants from Caribbean |
| Minimum | 8.5% | 11.1% |
| Maximum | 29.6% | 23.2% |
| Range | 21.0% | 12.1% |
| Mean | 18.4% | 16.9% |
| Median | 18.1% | 17.4% |
| Interquartile 25% (IQ1) | 16.1% | 15.8% |
| Interquartile 75% (IQ3) | 20.4% | 18.1% |
| Interquartile Range (IQR) | 4.3% | 2.3% |
| Standard Deviation (Sample) | 4.4% | 2.0% |
| Standard Deviation (Population) | 4.4% | 2.0% |
Similar Demographics by Cognitive Disability
Demographics Similar to Central American Indians by Cognitive Disability
In terms of cognitive disability, the demographic groups most similar to Central American Indians are Iroquois (18.2%, a difference of 0.010%), British West Indian (18.2%, a difference of 0.070%), Ottawa (18.2%, a difference of 0.080%), Immigrants from Africa (18.1%, a difference of 0.21%), and Native/Alaskan (18.1%, a difference of 0.24%).
| Demographics | Rating | Rank | Cognitive Disability |
| Kenyans | 0.1 /100 | #286 | Tragic 18.1% |
| Dutch West Indians | 0.1 /100 | #287 | Tragic 18.1% |
| Immigrants | West Indies | 0.1 /100 | #288 | Tragic 18.1% |
| Natives/Alaskans | 0.1 /100 | #289 | Tragic 18.1% |
| Immigrants | Africa | 0.1 /100 | #290 | Tragic 18.1% |
| Ottawa | 0.1 /100 | #291 | Tragic 18.2% |
| Iroquois | 0.1 /100 | #292 | Tragic 18.2% |
| Central American Indians | 0.1 /100 | #293 | Tragic 18.2% |
| British West Indians | 0.1 /100 | #294 | Tragic 18.2% |
| German Russians | 0.0 /100 | #295 | Tragic 18.2% |
| Immigrants | Burma/Myanmar | 0.0 /100 | #296 | Tragic 18.2% |
| Blackfeet | 0.0 /100 | #297 | Tragic 18.3% |
| Japanese | 0.0 /100 | #298 | Tragic 18.3% |
| Ghanaians | 0.0 /100 | #299 | Tragic 18.3% |
| Creek | 0.0 /100 | #300 | Tragic 18.3% |
Demographics Similar to Immigrants from Caribbean by Cognitive Disability
In terms of cognitive disability, the demographic groups most similar to Immigrants from Caribbean are Immigrants from Zimbabwe (17.5%, a difference of 0.0%), Puget Sound Salish (17.5%, a difference of 0.010%), Alaska Native (17.5%, a difference of 0.050%), Immigrants from Morocco (17.5%, a difference of 0.070%), and Immigrants from Latin America (17.6%, a difference of 0.10%).
| Demographics | Rating | Rank | Cognitive Disability |
| Guyanese | 17.5 /100 | #196 | Poor 17.5% |
| Immigrants | Afghanistan | 16.7 /100 | #197 | Poor 17.5% |
| Immigrants | Panama | 14.8 /100 | #198 | Poor 17.5% |
| Immigrants | Singapore | 14.3 /100 | #199 | Poor 17.5% |
| Haitians | 14.1 /100 | #200 | Poor 17.5% |
| South American Indians | 13.0 /100 | #201 | Poor 17.5% |
| Immigrants | Morocco | 12.0 /100 | #202 | Poor 17.5% |
| Immigrants | Caribbean | 11.0 /100 | #203 | Poor 17.5% |
| Immigrants | Zimbabwe | 11.0 /100 | #204 | Poor 17.5% |
| Puget Sound Salish | 10.9 /100 | #205 | Poor 17.5% |
| Alaska Natives | 10.4 /100 | #206 | Poor 17.5% |
| Immigrants | Latin America | 9.7 /100 | #207 | Tragic 17.6% |
| Immigrants | Cameroon | 9.3 /100 | #208 | Tragic 17.6% |
| Immigrants | Trinidad and Tobago | 8.7 /100 | #209 | Tragic 17.6% |
| Immigrants | Jamaica | 8.5 /100 | #210 | Tragic 17.6% |