Celtic vs Immigrants from Caribbean Cognitive Disability
COMPARE
Celtic
Immigrants from Caribbean
Cognitive Disability
Cognitive Disability Comparison
Celtics
Immigrants from Caribbean
17.1%
COGNITIVE DISABILITY
74.1/ 100
METRIC RATING
158th/ 347
METRIC RANK
17.5%
COGNITIVE DISABILITY
11.0/ 100
METRIC RATING
203rd/ 347
METRIC RANK
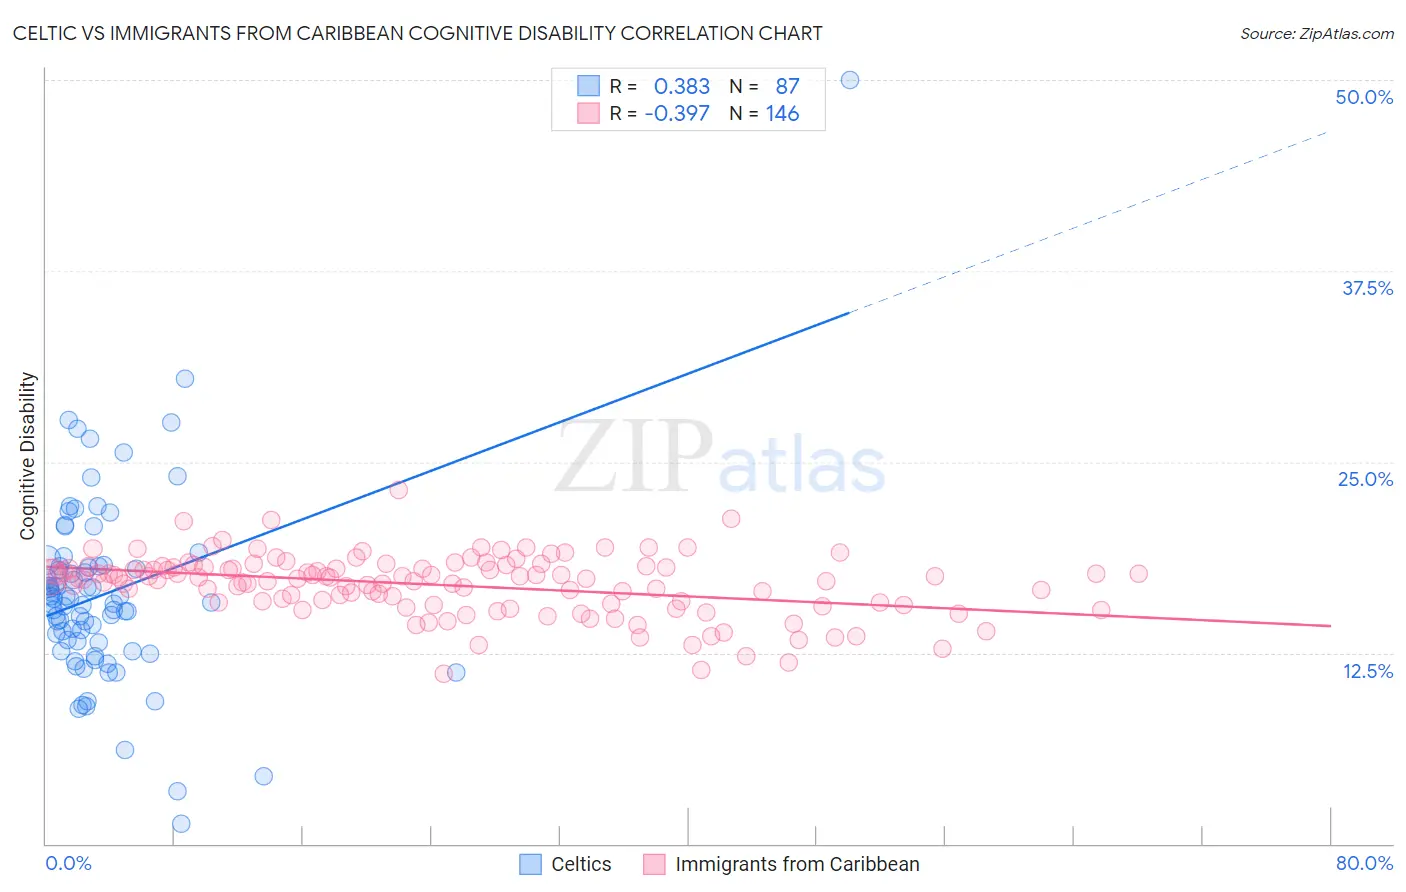
Celtic vs Immigrants from Caribbean Cognitive Disability Correlation Chart
The statistical analysis conducted on geographies consisting of 168,858,493 people shows a mild positive correlation between the proportion of Celtics and percentage of population with cognitive disability in the United States with a correlation coefficient (R) of 0.383 and weighted average of 17.1%. Similarly, the statistical analysis conducted on geographies consisting of 449,949,141 people shows a mild negative correlation between the proportion of Immigrants from Caribbean and percentage of population with cognitive disability in the United States with a correlation coefficient (R) of -0.397 and weighted average of 17.5%, a difference of 2.2%.
Cognitive Disability Correlation Summary
| Measurement | Celtic | Immigrants from Caribbean |
| Minimum | 1.3% | 11.1% |
| Maximum | 50.0% | 23.2% |
| Range | 48.7% | 12.1% |
| Mean | 16.4% | 16.9% |
| Median | 15.8% | 17.4% |
| Interquartile 25% (IQ1) | 13.2% | 15.8% |
| Interquartile 75% (IQ3) | 18.2% | 18.1% |
| Interquartile Range (IQR) | 5.0% | 2.3% |
| Standard Deviation (Sample) | 6.4% | 2.0% |
| Standard Deviation (Population) | 6.3% | 2.0% |
Similar Demographics by Cognitive Disability
Demographics Similar to Celtics by Cognitive Disability
In terms of cognitive disability, the demographic groups most similar to Celtics are Immigrants from Latvia (17.2%, a difference of 0.030%), Australian (17.2%, a difference of 0.060%), Immigrants from Australia (17.1%, a difference of 0.070%), American (17.2%, a difference of 0.070%), and Yugoslavian (17.2%, a difference of 0.090%).
| Demographics | Rating | Rank | Cognitive Disability |
| Syrians | 83.0 /100 | #151 | Excellent 17.1% |
| Immigrants | Indonesia | 82.7 /100 | #152 | Excellent 17.1% |
| Immigrants | Kazakhstan | 80.5 /100 | #153 | Excellent 17.1% |
| Immigrants | Malaysia | 79.3 /100 | #154 | Good 17.1% |
| Brazilians | 78.9 /100 | #155 | Good 17.1% |
| Sri Lankans | 78.9 /100 | #156 | Good 17.1% |
| Immigrants | Australia | 76.0 /100 | #157 | Good 17.1% |
| Celtics | 74.1 /100 | #158 | Good 17.1% |
| Immigrants | Latvia | 73.2 /100 | #159 | Good 17.2% |
| Australians | 72.4 /100 | #160 | Good 17.2% |
| Americans | 72.2 /100 | #161 | Good 17.2% |
| Yugoslavians | 71.6 /100 | #162 | Good 17.2% |
| Immigrants | Switzerland | 71.5 /100 | #163 | Good 17.2% |
| Armenians | 70.1 /100 | #164 | Good 17.2% |
| Immigrants | Albania | 64.9 /100 | #165 | Good 17.2% |
Demographics Similar to Immigrants from Caribbean by Cognitive Disability
In terms of cognitive disability, the demographic groups most similar to Immigrants from Caribbean are Immigrants from Zimbabwe (17.5%, a difference of 0.0%), Puget Sound Salish (17.5%, a difference of 0.010%), Alaska Native (17.5%, a difference of 0.050%), Immigrants from Morocco (17.5%, a difference of 0.070%), and Immigrants from Latin America (17.6%, a difference of 0.10%).
| Demographics | Rating | Rank | Cognitive Disability |
| Guyanese | 17.5 /100 | #196 | Poor 17.5% |
| Immigrants | Afghanistan | 16.7 /100 | #197 | Poor 17.5% |
| Immigrants | Panama | 14.8 /100 | #198 | Poor 17.5% |
| Immigrants | Singapore | 14.3 /100 | #199 | Poor 17.5% |
| Haitians | 14.1 /100 | #200 | Poor 17.5% |
| South American Indians | 13.0 /100 | #201 | Poor 17.5% |
| Immigrants | Morocco | 12.0 /100 | #202 | Poor 17.5% |
| Immigrants | Caribbean | 11.0 /100 | #203 | Poor 17.5% |
| Immigrants | Zimbabwe | 11.0 /100 | #204 | Poor 17.5% |
| Puget Sound Salish | 10.9 /100 | #205 | Poor 17.5% |
| Alaska Natives | 10.4 /100 | #206 | Poor 17.5% |
| Immigrants | Latin America | 9.7 /100 | #207 | Tragic 17.6% |
| Immigrants | Cameroon | 9.3 /100 | #208 | Tragic 17.6% |
| Immigrants | Trinidad and Tobago | 8.7 /100 | #209 | Tragic 17.6% |
| Immigrants | Jamaica | 8.5 /100 | #210 | Tragic 17.6% |