Menominee vs Immigrants from Eritrea Householder Income Over 65 years
COMPARE
Menominee
Immigrants from Eritrea
Householder Income Over 65 years
Householder Income Over 65 years Comparison
Menominee
Immigrants from Eritrea
$51,719
HOUSEHOLDER INCOME OVER 65 YEARS
0.0/ 100
METRIC RATING
321st/ 347
METRIC RANK
$60,096
HOUSEHOLDER INCOME OVER 65 YEARS
28.6/ 100
METRIC RATING
188th/ 347
METRIC RANK
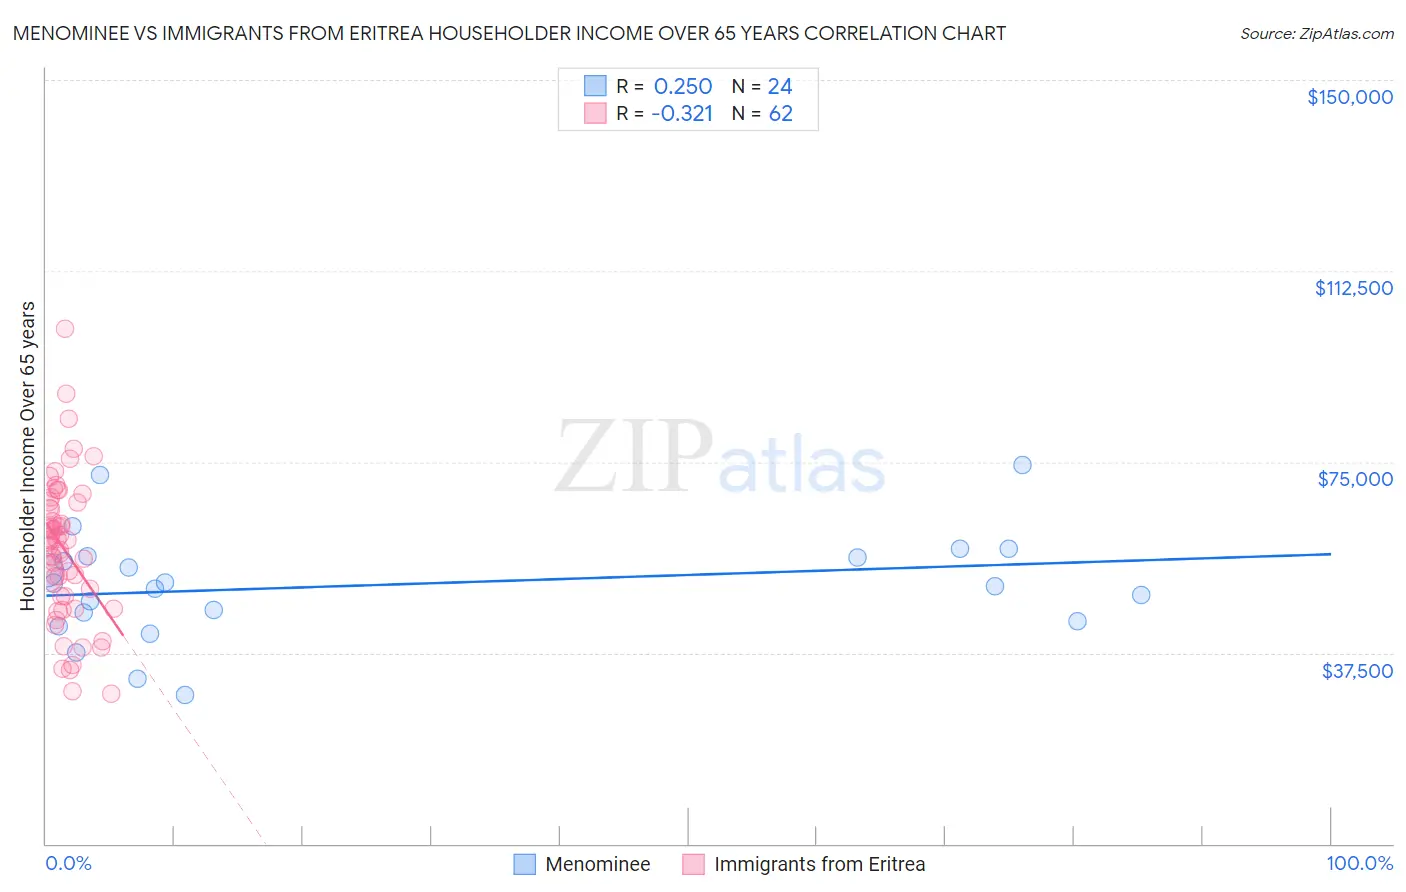
Menominee vs Immigrants from Eritrea Householder Income Over 65 years Correlation Chart
The statistical analysis conducted on geographies consisting of 45,767,067 people shows a weak positive correlation between the proportion of Menominee and household income with householder over the age of 65 in the United States with a correlation coefficient (R) of 0.250 and weighted average of $51,719. Similarly, the statistical analysis conducted on geographies consisting of 104,821,031 people shows a mild negative correlation between the proportion of Immigrants from Eritrea and household income with householder over the age of 65 in the United States with a correlation coefficient (R) of -0.321 and weighted average of $60,096, a difference of 16.2%.
Householder Income Over 65 years Correlation Summary
| Measurement | Menominee | Immigrants from Eritrea |
| Minimum | $29,125 | $29,432 |
| Maximum | $74,432 | $101,078 |
| Range | $45,307 | $71,646 |
| Mean | $50,793 | $57,826 |
| Median | $50,939 | $59,523 |
| Interquartile 25% (IQ1) | $44,602 | $48,607 |
| Interquartile 75% (IQ3) | $56,259 | $67,083 |
| Interquartile Range (IQR) | $11,657 | $18,476 |
| Standard Deviation (Sample) | $10,695 | $14,156 |
| Standard Deviation (Population) | $10,470 | $14,041 |
Similar Demographics by Householder Income Over 65 years
Demographics Similar to Menominee by Householder Income Over 65 years
In terms of householder income over 65 years, the demographic groups most similar to Menominee are Colville ($51,739, a difference of 0.040%), Immigrants from Honduras ($51,888, a difference of 0.33%), Haitian ($51,912, a difference of 0.37%), Immigrants from St. Vincent and the Grenadines ($51,922, a difference of 0.39%), and Creek ($51,949, a difference of 0.45%).
| Demographics | Rating | Rank | Householder Income Over 65 years |
| Natives/Alaskans | 0.0 /100 | #314 | Tragic $52,081 |
| U.S. Virgin Islanders | 0.0 /100 | #315 | Tragic $52,072 |
| Creek | 0.0 /100 | #316 | Tragic $51,949 |
| Immigrants | St. Vincent and the Grenadines | 0.0 /100 | #317 | Tragic $51,922 |
| Haitians | 0.0 /100 | #318 | Tragic $51,912 |
| Immigrants | Honduras | 0.0 /100 | #319 | Tragic $51,888 |
| Colville | 0.0 /100 | #320 | Tragic $51,739 |
| Menominee | 0.0 /100 | #321 | Tragic $51,719 |
| British West Indians | 0.0 /100 | #322 | Tragic $51,463 |
| Cajuns | 0.0 /100 | #323 | Tragic $51,397 |
| Immigrants | Congo | 0.0 /100 | #324 | Tragic $51,393 |
| Immigrants | Haiti | 0.0 /100 | #325 | Tragic $51,219 |
| Kiowa | 0.0 /100 | #326 | Tragic $51,140 |
| Bahamians | 0.0 /100 | #327 | Tragic $51,000 |
| Hopi | 0.0 /100 | #328 | Tragic $50,925 |
Demographics Similar to Immigrants from Eritrea by Householder Income Over 65 years
In terms of householder income over 65 years, the demographic groups most similar to Immigrants from Eritrea are Ghanaian ($60,043, a difference of 0.090%), Immigrants from Thailand ($60,217, a difference of 0.20%), Slovene ($60,241, a difference of 0.24%), Albanian ($60,249, a difference of 0.26%), and Puget Sound Salish ($59,934, a difference of 0.27%).
| Demographics | Rating | Rank | Householder Income Over 65 years |
| Celtics | 40.7 /100 | #181 | Average $60,608 |
| Czechoslovakians | 40.0 /100 | #182 | Average $60,581 |
| Kenyans | 38.4 /100 | #183 | Fair $60,514 |
| Iraqis | 37.2 /100 | #184 | Fair $60,466 |
| Albanians | 32.0 /100 | #185 | Fair $60,249 |
| Slovenes | 31.8 /100 | #186 | Fair $60,241 |
| Immigrants | Thailand | 31.3 /100 | #187 | Fair $60,217 |
| Immigrants | Eritrea | 28.6 /100 | #188 | Fair $60,096 |
| Ghanaians | 27.5 /100 | #189 | Fair $60,043 |
| Puget Sound Salish | 25.3 /100 | #190 | Fair $59,934 |
| Belgians | 24.9 /100 | #191 | Fair $59,915 |
| South Americans | 23.8 /100 | #192 | Fair $59,854 |
| Immigrants | Costa Rica | 23.6 /100 | #193 | Fair $59,848 |
| Immigrants | Africa | 23.4 /100 | #194 | Fair $59,837 |
| Immigrants | Iraq | 23.2 /100 | #195 | Fair $59,824 |