Menominee vs Immigrants from Eritrea 6th Grade
COMPARE
Menominee
Immigrants from Eritrea
6th Grade
6th Grade Comparison
Menominee
Immigrants from Eritrea
97.5%
6TH GRADE
97.7/ 100
METRIC RATING
106th/ 347
METRIC RANK
96.1%
6TH GRADE
0.0/ 100
METRIC RATING
289th/ 347
METRIC RANK
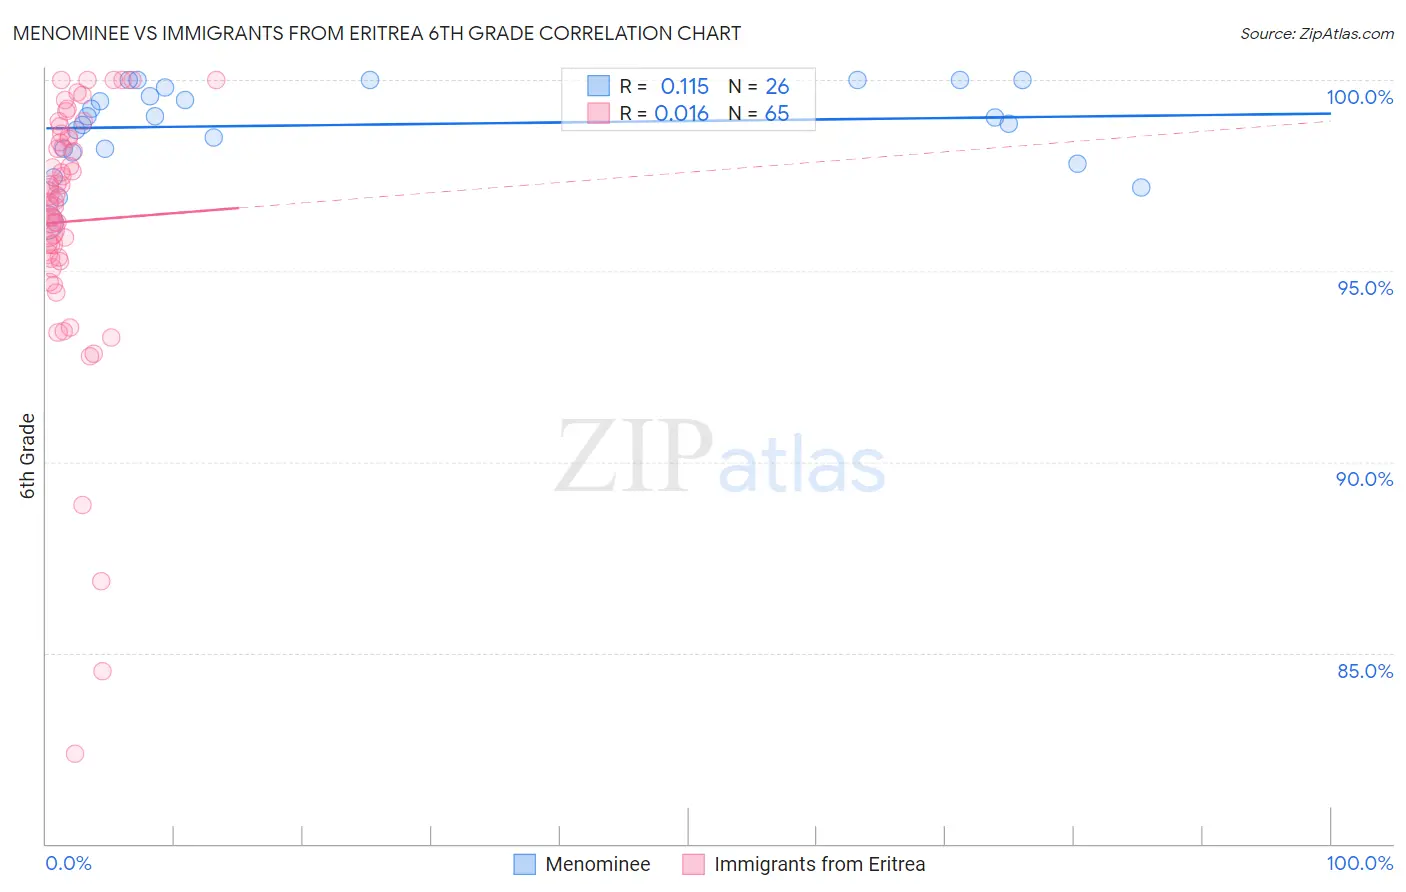
Menominee vs Immigrants from Eritrea 6th Grade Correlation Chart
The statistical analysis conducted on geographies consisting of 45,778,979 people shows a poor positive correlation between the proportion of Menominee and percentage of population with at least 6th grade education in the United States with a correlation coefficient (R) of 0.115 and weighted average of 97.5%. Similarly, the statistical analysis conducted on geographies consisting of 104,764,182 people shows no correlation between the proportion of Immigrants from Eritrea and percentage of population with at least 6th grade education in the United States with a correlation coefficient (R) of 0.016 and weighted average of 96.1%, a difference of 1.4%.
6th Grade Correlation Summary
| Measurement | Menominee | Immigrants from Eritrea |
| Minimum | 96.3% | 82.4% |
| Maximum | 100.0% | 100.0% |
| Range | 3.7% | 17.6% |
| Mean | 98.8% | 96.3% |
| Median | 99.0% | 96.8% |
| Interquartile 25% (IQ1) | 98.2% | 95.3% |
| Interquartile 75% (IQ3) | 99.8% | 98.5% |
| Interquartile Range (IQR) | 1.6% | 3.2% |
| Standard Deviation (Sample) | 1.1% | 3.4% |
| Standard Deviation (Population) | 1.0% | 3.4% |
Similar Demographics by 6th Grade
Demographics Similar to Menominee by 6th Grade
In terms of 6th grade, the demographic groups most similar to Menominee are Choctaw (97.5%, a difference of 0.010%), Bhutanese (97.5%, a difference of 0.010%), German Russian (97.5%, a difference of 0.010%), Cheyenne (97.5%, a difference of 0.010%), and Immigrants from Singapore (97.5%, a difference of 0.010%).
| Demographics | Rating | Rank | 6th Grade |
| Yugoslavians | 98.5 /100 | #99 | Exceptional 97.5% |
| Turks | 98.3 /100 | #100 | Exceptional 97.5% |
| South Africans | 98.2 /100 | #101 | Exceptional 97.5% |
| Choctaw | 98.0 /100 | #102 | Exceptional 97.5% |
| Bhutanese | 98.0 /100 | #103 | Exceptional 97.5% |
| German Russians | 97.9 /100 | #104 | Exceptional 97.5% |
| Cheyenne | 97.9 /100 | #105 | Exceptional 97.5% |
| Menominee | 97.7 /100 | #106 | Exceptional 97.5% |
| Immigrants | Singapore | 97.6 /100 | #107 | Exceptional 97.5% |
| Immigrants | Nonimmigrants | 97.3 /100 | #108 | Exceptional 97.4% |
| Immigrants | Czechoslovakia | 97.3 /100 | #109 | Exceptional 97.4% |
| Thais | 96.9 /100 | #110 | Exceptional 97.4% |
| Iroquois | 96.9 /100 | #111 | Exceptional 97.4% |
| Immigrants | Latvia | 96.7 /100 | #112 | Exceptional 97.4% |
| Immigrants | Saudi Arabia | 96.5 /100 | #113 | Exceptional 97.4% |
Demographics Similar to Immigrants from Eritrea by 6th Grade
In terms of 6th grade, the demographic groups most similar to Immigrants from Eritrea are Malaysian (96.2%, a difference of 0.020%), Immigrants from Somalia (96.1%, a difference of 0.020%), Immigrants from St. Vincent and the Grenadines (96.1%, a difference of 0.020%), Immigrants from Trinidad and Tobago (96.2%, a difference of 0.030%), and Barbadian (96.2%, a difference of 0.040%).
| Demographics | Rating | Rank | 6th Grade |
| Houma | 0.1 /100 | #282 | Tragic 96.2% |
| Cubans | 0.1 /100 | #283 | Tragic 96.2% |
| Fijians | 0.1 /100 | #284 | Tragic 96.2% |
| Somalis | 0.1 /100 | #285 | Tragic 96.2% |
| Barbadians | 0.0 /100 | #286 | Tragic 96.2% |
| Immigrants | Trinidad and Tobago | 0.0 /100 | #287 | Tragic 96.2% |
| Malaysians | 0.0 /100 | #288 | Tragic 96.2% |
| Immigrants | Eritrea | 0.0 /100 | #289 | Tragic 96.1% |
| Immigrants | Somalia | 0.0 /100 | #290 | Tragic 96.1% |
| Immigrants | St. Vincent and the Grenadines | 0.0 /100 | #291 | Tragic 96.1% |
| Immigrants | Barbados | 0.0 /100 | #292 | Tragic 96.1% |
| Immigrants | West Indies | 0.0 /100 | #293 | Tragic 96.1% |
| British West Indians | 0.0 /100 | #294 | Tragic 96.0% |
| Immigrants | Grenada | 0.0 /100 | #295 | Tragic 95.9% |
| Immigrants | South Eastern Asia | 0.0 /100 | #296 | Tragic 95.9% |