Marshallese vs Shoshone Self-Care Disability
COMPARE
Marshallese
Shoshone
Self-Care Disability
Self-Care Disability Comparison
Marshallese
Shoshone
2.6%
SELF-CARE DISABILITY
1.2/ 100
METRIC RATING
240th/ 347
METRIC RANK
2.7%
SELF-CARE DISABILITY
0.2/ 100
METRIC RATING
262nd/ 347
METRIC RANK
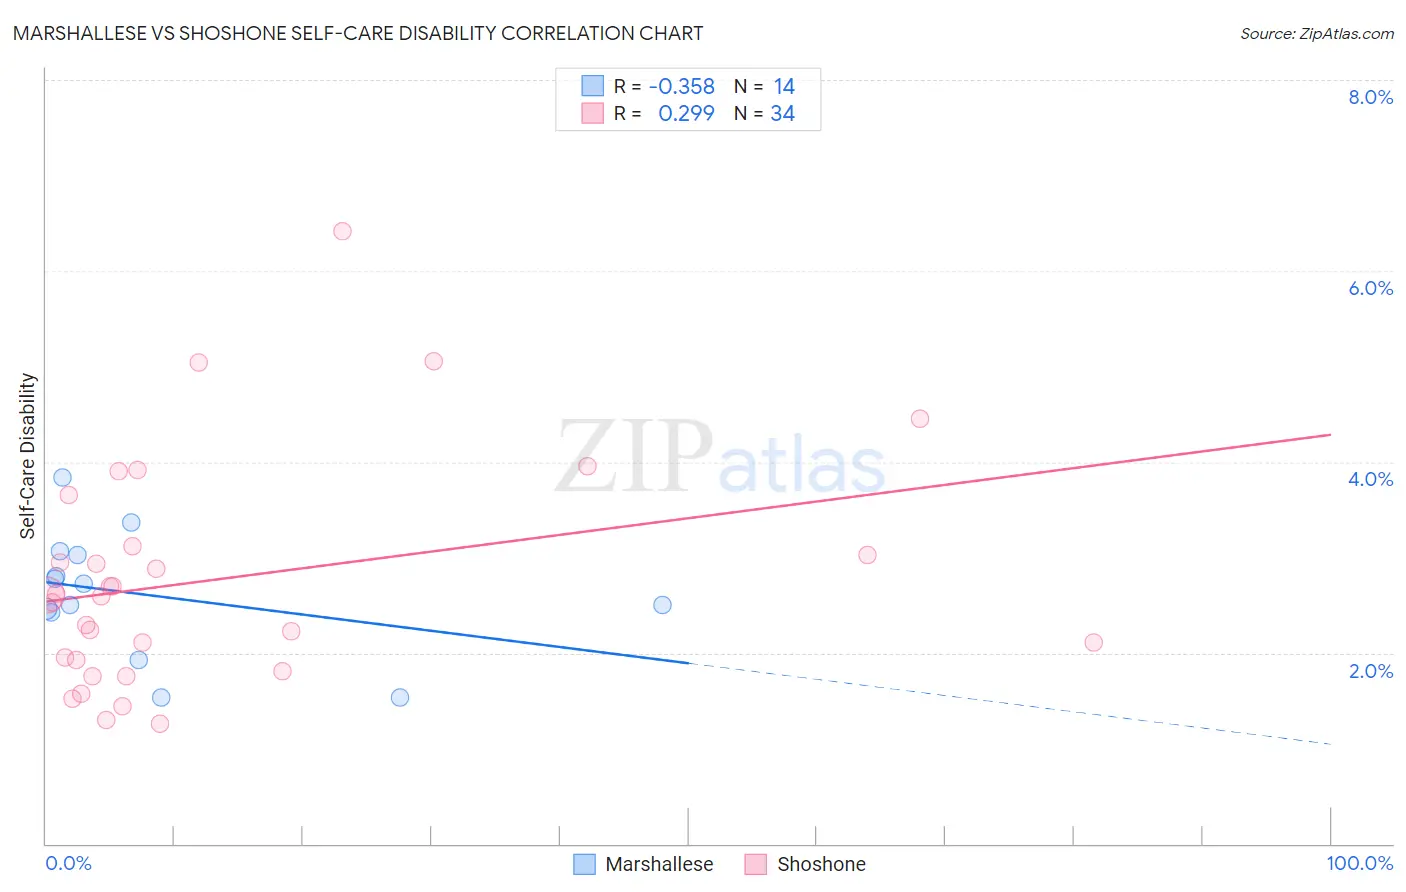
Marshallese vs Shoshone Self-Care Disability Correlation Chart
The statistical analysis conducted on geographies consisting of 14,760,594 people shows a mild negative correlation between the proportion of Marshallese and percentage of population with self-care disability in the United States with a correlation coefficient (R) of -0.358 and weighted average of 2.6%. Similarly, the statistical analysis conducted on geographies consisting of 66,602,843 people shows a weak positive correlation between the proportion of Shoshone and percentage of population with self-care disability in the United States with a correlation coefficient (R) of 0.299 and weighted average of 2.7%, a difference of 2.0%.
Self-Care Disability Correlation Summary
| Measurement | Marshallese | Shoshone |
| Minimum | 1.5% | 1.3% |
| Maximum | 3.8% | 6.4% |
| Range | 2.3% | 5.2% |
| Mean | 2.6% | 2.8% |
| Median | 2.6% | 2.6% |
| Interquartile 25% (IQ1) | 2.4% | 1.9% |
| Interquartile 75% (IQ3) | 3.0% | 3.1% |
| Interquartile Range (IQR) | 0.59% | 1.2% |
| Standard Deviation (Sample) | 0.64% | 1.2% |
| Standard Deviation (Population) | 0.62% | 1.2% |
Similar Demographics by Self-Care Disability
Demographics Similar to Marshallese by Self-Care Disability
In terms of self-care disability, the demographic groups most similar to Marshallese are Immigrants from Panama (2.6%, a difference of 0.030%), Senegalese (2.6%, a difference of 0.070%), Immigrants from Syria (2.6%, a difference of 0.17%), Immigrants from Senegal (2.6%, a difference of 0.33%), and Spanish (2.6%, a difference of 0.41%).
| Demographics | Rating | Rank | Self-Care Disability |
| Liberians | 2.1 /100 | #233 | Tragic 2.6% |
| Vietnamese | 2.1 /100 | #234 | Tragic 2.6% |
| Bahamians | 2.0 /100 | #235 | Tragic 2.6% |
| Bermudans | 1.9 /100 | #236 | Tragic 2.6% |
| Immigrants | Senegal | 1.6 /100 | #237 | Tragic 2.6% |
| Senegalese | 1.3 /100 | #238 | Tragic 2.6% |
| Immigrants | Panama | 1.2 /100 | #239 | Tragic 2.6% |
| Marshallese | 1.2 /100 | #240 | Tragic 2.6% |
| Immigrants | Syria | 1.0 /100 | #241 | Tragic 2.6% |
| Spanish | 0.8 /100 | #242 | Tragic 2.6% |
| Hawaiians | 0.8 /100 | #243 | Tragic 2.6% |
| Yuman | 0.8 /100 | #244 | Tragic 2.6% |
| Immigrants | Western Asia | 0.6 /100 | #245 | Tragic 2.6% |
| Cheyenne | 0.6 /100 | #246 | Tragic 2.6% |
| Immigrants | Albania | 0.6 /100 | #247 | Tragic 2.6% |
Demographics Similar to Shoshone by Self-Care Disability
In terms of self-care disability, the demographic groups most similar to Shoshone are Immigrants from Latin America (2.7%, a difference of 0.070%), Immigrants from Iran (2.7%, a difference of 0.13%), Arapaho (2.6%, a difference of 0.14%), Chippewa (2.6%, a difference of 0.16%), and Immigrants from Belarus (2.6%, a difference of 0.20%).
| Demographics | Rating | Rank | Self-Care Disability |
| Tsimshian | 0.3 /100 | #255 | Tragic 2.6% |
| Immigrants | Central America | 0.3 /100 | #256 | Tragic 2.6% |
| Potawatomi | 0.3 /100 | #257 | Tragic 2.6% |
| Immigrants | Nonimmigrants | 0.3 /100 | #258 | Tragic 2.6% |
| Immigrants | Belarus | 0.2 /100 | #259 | Tragic 2.6% |
| Chippewa | 0.2 /100 | #260 | Tragic 2.6% |
| Arapaho | 0.2 /100 | #261 | Tragic 2.6% |
| Shoshone | 0.2 /100 | #262 | Tragic 2.7% |
| Immigrants | Latin America | 0.2 /100 | #263 | Tragic 2.7% |
| Immigrants | Iran | 0.2 /100 | #264 | Tragic 2.7% |
| Immigrants | Nicaragua | 0.2 /100 | #265 | Tragic 2.7% |
| Immigrants | Cambodia | 0.1 /100 | #266 | Tragic 2.7% |
| Yaqui | 0.1 /100 | #267 | Tragic 2.7% |
| Immigrants | Mexico | 0.1 /100 | #268 | Tragic 2.7% |
| U.S. Virgin Islanders | 0.1 /100 | #269 | Tragic 2.7% |