Menominee vs Shoshone Self-Care Disability
COMPARE
Menominee
Shoshone
Self-Care Disability
Self-Care Disability Comparison
Menominee
Shoshone
2.8%
SELF-CARE DISABILITY
0.0/ 100
METRIC RATING
316th/ 347
METRIC RANK
2.7%
SELF-CARE DISABILITY
0.2/ 100
METRIC RATING
262nd/ 347
METRIC RANK
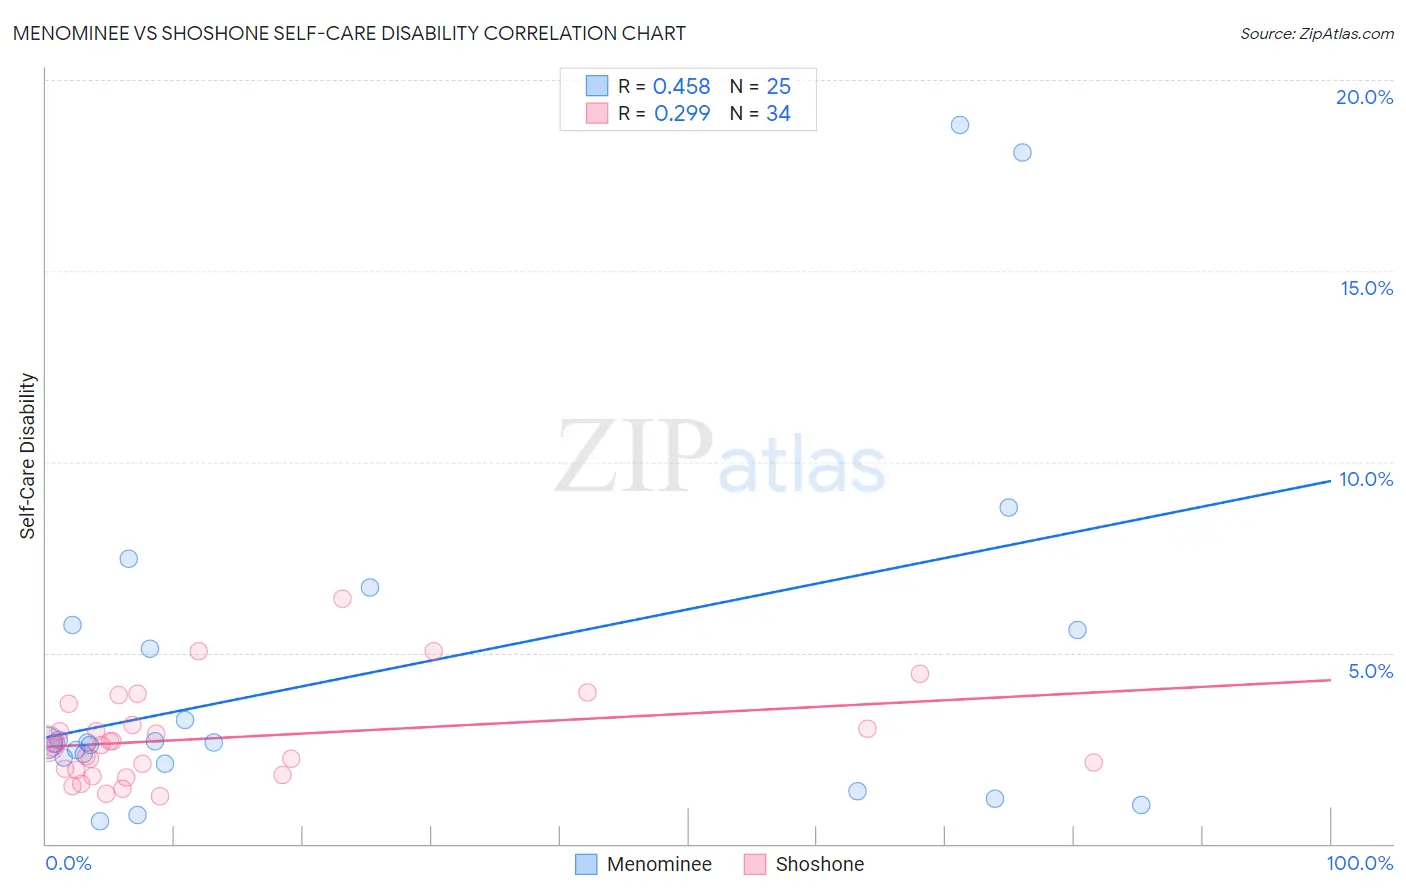
Menominee vs Shoshone Self-Care Disability Correlation Chart
The statistical analysis conducted on geographies consisting of 45,776,619 people shows a moderate positive correlation between the proportion of Menominee and percentage of population with self-care disability in the United States with a correlation coefficient (R) of 0.458 and weighted average of 2.8%. Similarly, the statistical analysis conducted on geographies consisting of 66,602,843 people shows a weak positive correlation between the proportion of Shoshone and percentage of population with self-care disability in the United States with a correlation coefficient (R) of 0.299 and weighted average of 2.7%, a difference of 7.4%.
Self-Care Disability Correlation Summary
| Measurement | Menominee | Shoshone |
| Minimum | 0.59% | 1.3% |
| Maximum | 18.8% | 6.4% |
| Range | 18.2% | 5.2% |
| Mean | 4.5% | 2.8% |
| Median | 2.6% | 2.6% |
| Interquartile 25% (IQ1) | 2.2% | 1.9% |
| Interquartile 75% (IQ3) | 5.7% | 3.1% |
| Interquartile Range (IQR) | 3.5% | 1.2% |
| Standard Deviation (Sample) | 4.7% | 1.2% |
| Standard Deviation (Population) | 4.6% | 1.2% |
Similar Demographics by Self-Care Disability
Demographics Similar to Menominee by Self-Care Disability
In terms of self-care disability, the demographic groups most similar to Menominee are Immigrants from Cuba (2.8%, a difference of 0.10%), Immigrants from Dominica (2.8%, a difference of 0.13%), Assyrian/Chaldean/Syriac (2.8%, a difference of 0.14%), Spanish American Indian (2.9%, a difference of 0.29%), and Creek (2.8%, a difference of 0.32%).
| Demographics | Rating | Rank | Self-Care Disability |
| Bangladeshis | 0.0 /100 | #309 | Tragic 2.8% |
| British West Indians | 0.0 /100 | #310 | Tragic 2.8% |
| Puget Sound Salish | 0.0 /100 | #311 | Tragic 2.8% |
| Immigrants | Caribbean | 0.0 /100 | #312 | Tragic 2.8% |
| Spanish Americans | 0.0 /100 | #313 | Tragic 2.8% |
| Creek | 0.0 /100 | #314 | Tragic 2.8% |
| Immigrants | Cuba | 0.0 /100 | #315 | Tragic 2.8% |
| Menominee | 0.0 /100 | #316 | Tragic 2.8% |
| Immigrants | Dominica | 0.0 /100 | #317 | Tragic 2.8% |
| Assyrians/Chaldeans/Syriacs | 0.0 /100 | #318 | Tragic 2.8% |
| Spanish American Indians | 0.0 /100 | #319 | Tragic 2.9% |
| Chickasaw | 0.0 /100 | #320 | Tragic 2.9% |
| Navajo | 0.0 /100 | #321 | Tragic 2.9% |
| Comanche | 0.0 /100 | #322 | Tragic 2.9% |
| Seminole | 0.0 /100 | #323 | Tragic 2.9% |
Demographics Similar to Shoshone by Self-Care Disability
In terms of self-care disability, the demographic groups most similar to Shoshone are Immigrants from Latin America (2.7%, a difference of 0.070%), Immigrants from Iran (2.7%, a difference of 0.13%), Arapaho (2.6%, a difference of 0.14%), Chippewa (2.6%, a difference of 0.16%), and Immigrants from Belarus (2.6%, a difference of 0.20%).
| Demographics | Rating | Rank | Self-Care Disability |
| Tsimshian | 0.3 /100 | #255 | Tragic 2.6% |
| Immigrants | Central America | 0.3 /100 | #256 | Tragic 2.6% |
| Potawatomi | 0.3 /100 | #257 | Tragic 2.6% |
| Immigrants | Nonimmigrants | 0.3 /100 | #258 | Tragic 2.6% |
| Immigrants | Belarus | 0.2 /100 | #259 | Tragic 2.6% |
| Chippewa | 0.2 /100 | #260 | Tragic 2.6% |
| Arapaho | 0.2 /100 | #261 | Tragic 2.6% |
| Shoshone | 0.2 /100 | #262 | Tragic 2.7% |
| Immigrants | Latin America | 0.2 /100 | #263 | Tragic 2.7% |
| Immigrants | Iran | 0.2 /100 | #264 | Tragic 2.7% |
| Immigrants | Nicaragua | 0.2 /100 | #265 | Tragic 2.7% |
| Immigrants | Cambodia | 0.1 /100 | #266 | Tragic 2.7% |
| Yaqui | 0.1 /100 | #267 | Tragic 2.7% |
| Immigrants | Mexico | 0.1 /100 | #268 | Tragic 2.7% |
| U.S. Virgin Islanders | 0.1 /100 | #269 | Tragic 2.7% |