Marshallese vs Russian High School Diploma
COMPARE
Marshallese
Russian
High School Diploma
High School Diploma Comparison
Marshallese
Russians
88.6%
HIGH SCHOOL DIPLOMA
18.7/ 100
METRIC RATING
199th/ 347
METRIC RANK
91.5%
HIGH SCHOOL DIPLOMA
99.9/ 100
METRIC RATING
26th/ 347
METRIC RANK
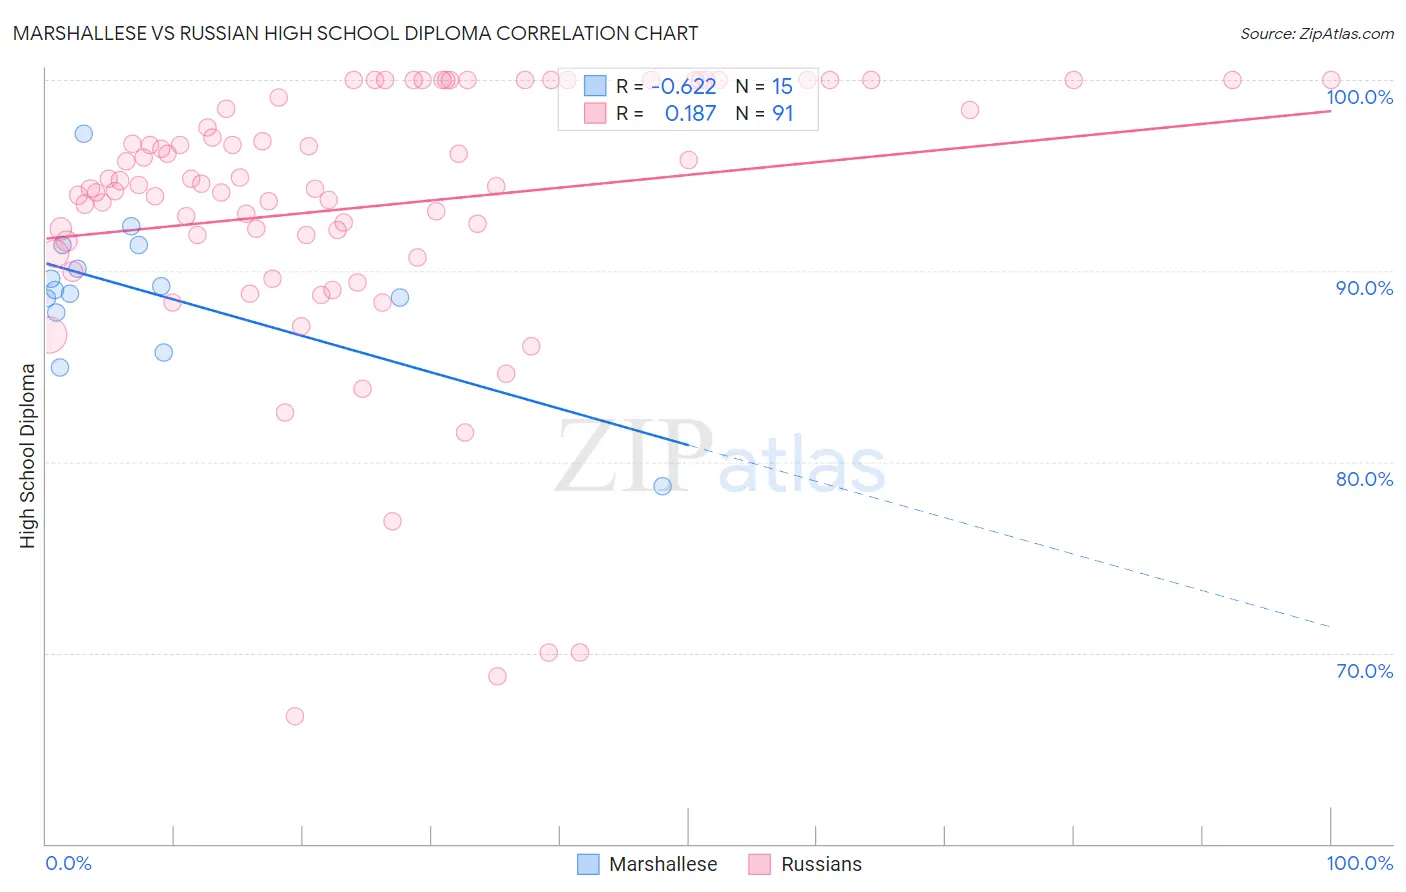
Marshallese vs Russian High School Diploma Correlation Chart
The statistical analysis conducted on geographies consisting of 14,760,991 people shows a significant negative correlation between the proportion of Marshallese and percentage of population with at least high school diploma education in the United States with a correlation coefficient (R) of -0.622 and weighted average of 88.6%. Similarly, the statistical analysis conducted on geographies consisting of 512,259,122 people shows a poor positive correlation between the proportion of Russians and percentage of population with at least high school diploma education in the United States with a correlation coefficient (R) of 0.187 and weighted average of 91.5%, a difference of 3.2%.
High School Diploma Correlation Summary
| Measurement | Marshallese | Russian |
| Minimum | 78.7% | 66.7% |
| Maximum | 97.2% | 100.0% |
| Range | 18.5% | 33.3% |
| Mean | 88.9% | 93.4% |
| Median | 89.0% | 94.5% |
| Interquartile 25% (IQ1) | 87.8% | 91.6% |
| Interquartile 75% (IQ3) | 91.3% | 100.0% |
| Interquartile Range (IQR) | 3.5% | 8.4% |
| Standard Deviation (Sample) | 4.0% | 7.2% |
| Standard Deviation (Population) | 3.9% | 7.2% |
Similar Demographics by High School Diploma
Demographics Similar to Marshallese by High School Diploma
In terms of high school diploma, the demographic groups most similar to Marshallese are Liberian (88.7%, a difference of 0.0%), Hawaiian (88.6%, a difference of 0.010%), Korean (88.6%, a difference of 0.010%), Panamanian (88.6%, a difference of 0.020%), and Somali (88.6%, a difference of 0.030%).
| Demographics | Rating | Rank | High School Diploma |
| Moroccans | 29.5 /100 | #192 | Fair 88.8% |
| Immigrants | Oceania | 26.9 /100 | #193 | Fair 88.8% |
| Immigrants | Venezuela | 25.8 /100 | #194 | Fair 88.8% |
| Afghans | 23.9 /100 | #195 | Fair 88.8% |
| Immigrants | Southern Europe | 23.4 /100 | #196 | Fair 88.7% |
| French American Indians | 21.5 /100 | #197 | Fair 88.7% |
| Liberians | 18.8 /100 | #198 | Poor 88.7% |
| Marshallese | 18.7 /100 | #199 | Poor 88.6% |
| Hawaiians | 18.3 /100 | #200 | Poor 88.6% |
| Koreans | 18.1 /100 | #201 | Poor 88.6% |
| Panamanians | 18.0 /100 | #202 | Poor 88.6% |
| Somalis | 17.5 /100 | #203 | Poor 88.6% |
| Armenians | 17.2 /100 | #204 | Poor 88.6% |
| Immigrants | Micronesia | 16.4 /100 | #205 | Poor 88.6% |
| Arapaho | 16.1 /100 | #206 | Poor 88.6% |
Demographics Similar to Russians by High School Diploma
In terms of high school diploma, the demographic groups most similar to Russians are Cypriot (91.5%, a difference of 0.010%), Italian (91.5%, a difference of 0.050%), Thai (91.5%, a difference of 0.050%), Tlingit-Haida (91.4%, a difference of 0.050%), and Scandinavian (91.5%, a difference of 0.060%).
| Demographics | Rating | Rank | High School Diploma |
| Maltese | 99.9 /100 | #19 | Exceptional 91.6% |
| Czechs | 99.9 /100 | #20 | Exceptional 91.6% |
| Filipinos | 99.9 /100 | #21 | Exceptional 91.6% |
| Estonians | 99.9 /100 | #22 | Exceptional 91.6% |
| Scandinavians | 99.9 /100 | #23 | Exceptional 91.5% |
| Italians | 99.9 /100 | #24 | Exceptional 91.5% |
| Thais | 99.9 /100 | #25 | Exceptional 91.5% |
| Russians | 99.9 /100 | #26 | Exceptional 91.5% |
| Cypriots | 99.9 /100 | #27 | Exceptional 91.5% |
| Tlingit-Haida | 99.9 /100 | #28 | Exceptional 91.4% |
| Europeans | 99.9 /100 | #29 | Exceptional 91.4% |
| Iranians | 99.9 /100 | #30 | Exceptional 91.4% |
| Immigrants | Northern Europe | 99.9 /100 | #31 | Exceptional 91.4% |
| English | 99.9 /100 | #32 | Exceptional 91.4% |
| Okinawans | 99.9 /100 | #33 | Exceptional 91.4% |