Immigrants from Israel vs Russian Male Disability
COMPARE
Immigrants from Israel
Russian
Male Disability
Male Disability Comparison
Immigrants from Israel
Russians
9.6%
MALE DISABILITY
100.0/ 100
METRIC RATING
10th/ 347
METRIC RANK
11.1%
MALE DISABILITY
69.8/ 100
METRIC RATING
156th/ 347
METRIC RANK
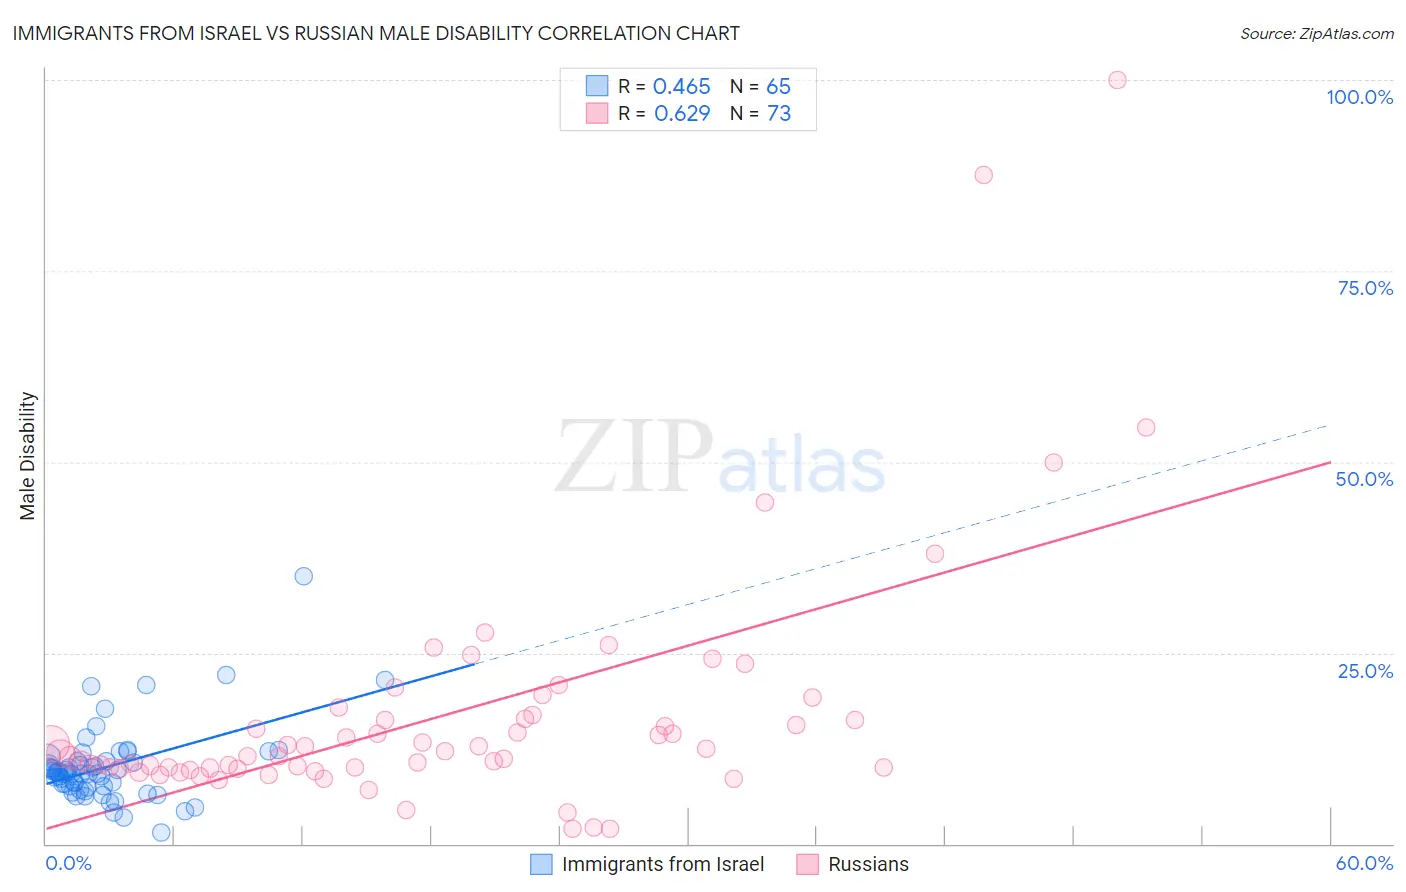
Immigrants from Israel vs Russian Male Disability Correlation Chart
The statistical analysis conducted on geographies consisting of 210,033,213 people shows a moderate positive correlation between the proportion of Immigrants from Israel and percentage of males with a disability in the United States with a correlation coefficient (R) of 0.465 and weighted average of 9.6%. Similarly, the statistical analysis conducted on geographies consisting of 512,092,434 people shows a significant positive correlation between the proportion of Russians and percentage of males with a disability in the United States with a correlation coefficient (R) of 0.629 and weighted average of 11.1%, a difference of 15.9%.
Male Disability Correlation Summary
| Measurement | Immigrants from Israel | Russian |
| Minimum | 1.5% | 2.0% |
| Maximum | 35.0% | 100.0% |
| Range | 33.5% | 98.0% |
| Mean | 10.1% | 16.8% |
| Median | 9.3% | 11.8% |
| Interquartile 25% (IQ1) | 7.4% | 9.9% |
| Interquartile 75% (IQ3) | 10.8% | 16.7% |
| Interquartile Range (IQR) | 3.4% | 6.8% |
| Standard Deviation (Sample) | 5.1% | 16.2% |
| Standard Deviation (Population) | 5.1% | 16.1% |
Similar Demographics by Male Disability
Demographics Similar to Immigrants from Israel by Male Disability
In terms of male disability, the demographic groups most similar to Immigrants from Israel are Immigrants from Singapore (9.5%, a difference of 0.43%), Immigrants from China (9.5%, a difference of 0.51%), Immigrants from Eastern Asia (9.6%, a difference of 0.55%), Bolivian (9.6%, a difference of 0.79%), and Iranian (9.7%, a difference of 1.0%).
| Demographics | Rating | Rank | Male Disability |
| Filipinos | 100.0 /100 | #3 | Exceptional 9.1% |
| Thais | 100.0 /100 | #4 | Exceptional 9.2% |
| Immigrants | Hong Kong | 100.0 /100 | #5 | Exceptional 9.4% |
| Immigrants | South Central Asia | 100.0 /100 | #6 | Exceptional 9.4% |
| Immigrants | Bolivia | 100.0 /100 | #7 | Exceptional 9.5% |
| Immigrants | China | 100.0 /100 | #8 | Exceptional 9.5% |
| Immigrants | Singapore | 100.0 /100 | #9 | Exceptional 9.5% |
| Immigrants | Israel | 100.0 /100 | #10 | Exceptional 9.6% |
| Immigrants | Eastern Asia | 100.0 /100 | #11 | Exceptional 9.6% |
| Bolivians | 100.0 /100 | #12 | Exceptional 9.6% |
| Iranians | 100.0 /100 | #13 | Exceptional 9.7% |
| Immigrants | Iran | 100.0 /100 | #14 | Exceptional 9.7% |
| Indians (Asian) | 100.0 /100 | #15 | Exceptional 9.7% |
| Okinawans | 100.0 /100 | #16 | Exceptional 9.8% |
| Immigrants | Korea | 100.0 /100 | #17 | Exceptional 9.8% |
Demographics Similar to Russians by Male Disability
In terms of male disability, the demographic groups most similar to Russians are Immigrants from Western Africa (11.1%, a difference of 0.040%), Immigrants from Middle Africa (11.1%, a difference of 0.070%), Latvian (11.1%, a difference of 0.11%), Guatemalan (11.1%, a difference of 0.17%), and Immigrants from Moldova (11.1%, a difference of 0.21%).
| Demographics | Rating | Rank | Male Disability |
| Immigrants | Denmark | 76.4 /100 | #149 | Good 11.0% |
| Immigrants | Guatemala | 75.1 /100 | #150 | Good 11.0% |
| Cubans | 74.9 /100 | #151 | Good 11.0% |
| Immigrants | Albania | 74.4 /100 | #152 | Good 11.0% |
| Immigrants | Northern Europe | 73.2 /100 | #153 | Good 11.1% |
| Immigrants | Moldova | 72.8 /100 | #154 | Good 11.1% |
| Immigrants | Middle Africa | 70.9 /100 | #155 | Good 11.1% |
| Russians | 69.8 /100 | #156 | Good 11.1% |
| Immigrants | Western Africa | 69.2 /100 | #157 | Good 11.1% |
| Latvians | 68.1 /100 | #158 | Good 11.1% |
| Guatemalans | 67.2 /100 | #159 | Good 11.1% |
| Albanians | 66.5 /100 | #160 | Good 11.1% |
| Immigrants | West Indies | 65.7 /100 | #161 | Good 11.1% |
| Immigrants | Haiti | 65.3 /100 | #162 | Good 11.1% |
| Immigrants | Kenya | 63.8 /100 | #163 | Good 11.1% |