Marshallese vs Immigrants from Venezuela Professional Degree
COMPARE
Marshallese
Immigrants from Venezuela
Professional Degree
Professional Degree Comparison
Marshallese
Immigrants from Venezuela
3.8%
PROFESSIONAL DEGREE
1.7/ 100
METRIC RATING
246th/ 347
METRIC RANK
4.8%
PROFESSIONAL DEGREE
93.8/ 100
METRIC RATING
123rd/ 347
METRIC RANK
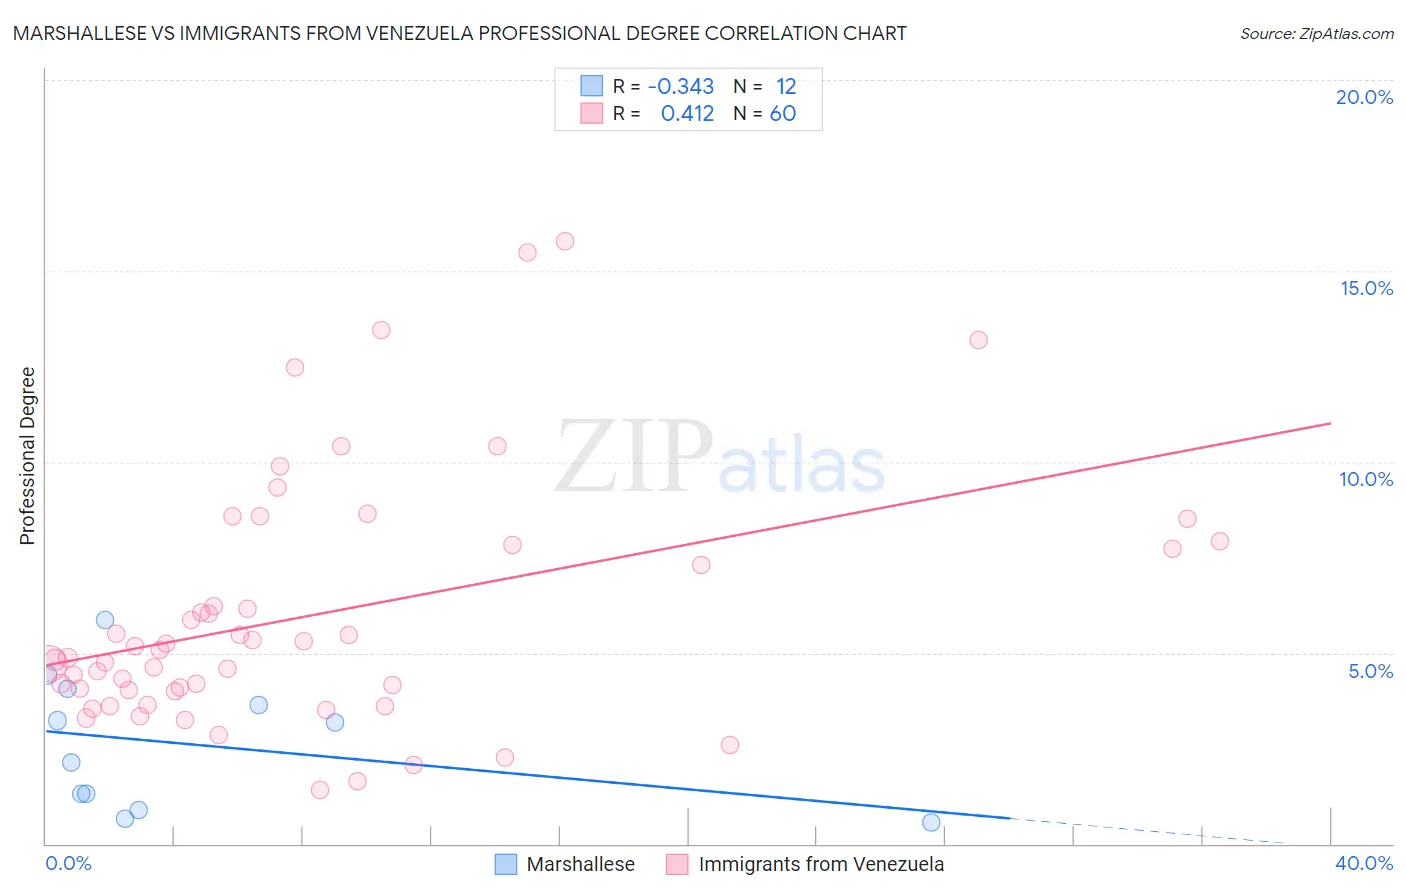
Marshallese vs Immigrants from Venezuela Professional Degree Correlation Chart
The statistical analysis conducted on geographies consisting of 14,750,149 people shows a mild negative correlation between the proportion of Marshallese and percentage of population with at least professional degree education in the United States with a correlation coefficient (R) of -0.343 and weighted average of 3.8%. Similarly, the statistical analysis conducted on geographies consisting of 287,618,886 people shows a moderate positive correlation between the proportion of Immigrants from Venezuela and percentage of population with at least professional degree education in the United States with a correlation coefficient (R) of 0.412 and weighted average of 4.8%, a difference of 29.0%.
Professional Degree Correlation Summary
| Measurement | Marshallese | Immigrants from Venezuela |
| Minimum | 0.57% | 1.4% |
| Maximum | 5.9% | 15.8% |
| Range | 5.3% | 14.4% |
| Mean | 2.6% | 6.0% |
| Median | 2.6% | 5.0% |
| Interquartile 25% (IQ1) | 1.1% | 4.0% |
| Interquartile 75% (IQ3) | 3.8% | 7.8% |
| Interquartile Range (IQR) | 2.8% | 3.8% |
| Standard Deviation (Sample) | 1.7% | 3.3% |
| Standard Deviation (Population) | 1.6% | 3.2% |
Similar Demographics by Professional Degree
Demographics Similar to Marshallese by Professional Degree
In terms of professional degree, the demographic groups most similar to Marshallese are Guyanese (3.8%, a difference of 0.020%), French American Indian (3.8%, a difference of 0.17%), Hmong (3.7%, a difference of 0.18%), Immigrants from Grenada (3.7%, a difference of 0.30%), and Immigrants from Fiji (3.7%, a difference of 0.36%).
| Demographics | Rating | Rank | Professional Degree |
| British West Indians | 2.4 /100 | #239 | Tragic 3.8% |
| Immigrants | Ecuador | 2.3 /100 | #240 | Tragic 3.8% |
| Alaskan Athabascans | 2.3 /100 | #241 | Tragic 3.8% |
| Native Hawaiians | 2.3 /100 | #242 | Tragic 3.8% |
| Guamanians/Chamorros | 2.2 /100 | #243 | Tragic 3.8% |
| Immigrants | Bahamas | 2.0 /100 | #244 | Tragic 3.8% |
| French American Indians | 1.7 /100 | #245 | Tragic 3.8% |
| Marshallese | 1.7 /100 | #246 | Tragic 3.8% |
| Guyanese | 1.6 /100 | #247 | Tragic 3.8% |
| Hmong | 1.6 /100 | #248 | Tragic 3.7% |
| Immigrants | Grenada | 1.5 /100 | #249 | Tragic 3.7% |
| Immigrants | Fiji | 1.5 /100 | #250 | Tragic 3.7% |
| Immigrants | Nicaragua | 1.4 /100 | #251 | Tragic 3.7% |
| Jamaicans | 1.4 /100 | #252 | Tragic 3.7% |
| Pueblo | 1.4 /100 | #253 | Tragic 3.7% |
Demographics Similar to Immigrants from Venezuela by Professional Degree
In terms of professional degree, the demographic groups most similar to Immigrants from Venezuela are Immigrants from Germany (4.9%, a difference of 0.17%), Immigrants from Eritrea (4.8%, a difference of 0.18%), Immigrants from Albania (4.8%, a difference of 0.31%), European (4.8%, a difference of 0.36%), and Immigrants from Moldova (4.9%, a difference of 0.63%).
| Demographics | Rating | Rank | Professional Degree |
| Venezuelans | 96.3 /100 | #116 | Exceptional 4.9% |
| Immigrants | Syria | 96.0 /100 | #117 | Exceptional 4.9% |
| Croatians | 96.0 /100 | #118 | Exceptional 4.9% |
| Immigrants | Sudan | 95.4 /100 | #119 | Exceptional 4.9% |
| Albanians | 95.3 /100 | #120 | Exceptional 4.9% |
| Immigrants | Moldova | 94.8 /100 | #121 | Exceptional 4.9% |
| Immigrants | Germany | 94.1 /100 | #122 | Exceptional 4.9% |
| Immigrants | Venezuela | 93.8 /100 | #123 | Exceptional 4.8% |
| Immigrants | Eritrea | 93.5 /100 | #124 | Exceptional 4.8% |
| Immigrants | Albania | 93.3 /100 | #125 | Exceptional 4.8% |
| Europeans | 93.2 /100 | #126 | Exceptional 4.8% |
| Serbians | 92.6 /100 | #127 | Exceptional 4.8% |
| Immigrants | Eastern Africa | 92.5 /100 | #128 | Exceptional 4.8% |
| Palestinians | 91.5 /100 | #129 | Exceptional 4.8% |
| Icelanders | 91.5 /100 | #130 | Exceptional 4.8% |