Indian (Asian) vs Immigrants from Venezuela Disability
COMPARE
Indian (Asian)
Immigrants from Venezuela
Disability
Disability Comparison
Indians (Asian)
Immigrants from Venezuela
10.3%
DISABILITY
100.0/ 100
METRIC RATING
16th/ 347
METRIC RANK
10.4%
DISABILITY
100.0/ 100
METRIC RATING
20th/ 347
METRIC RANK
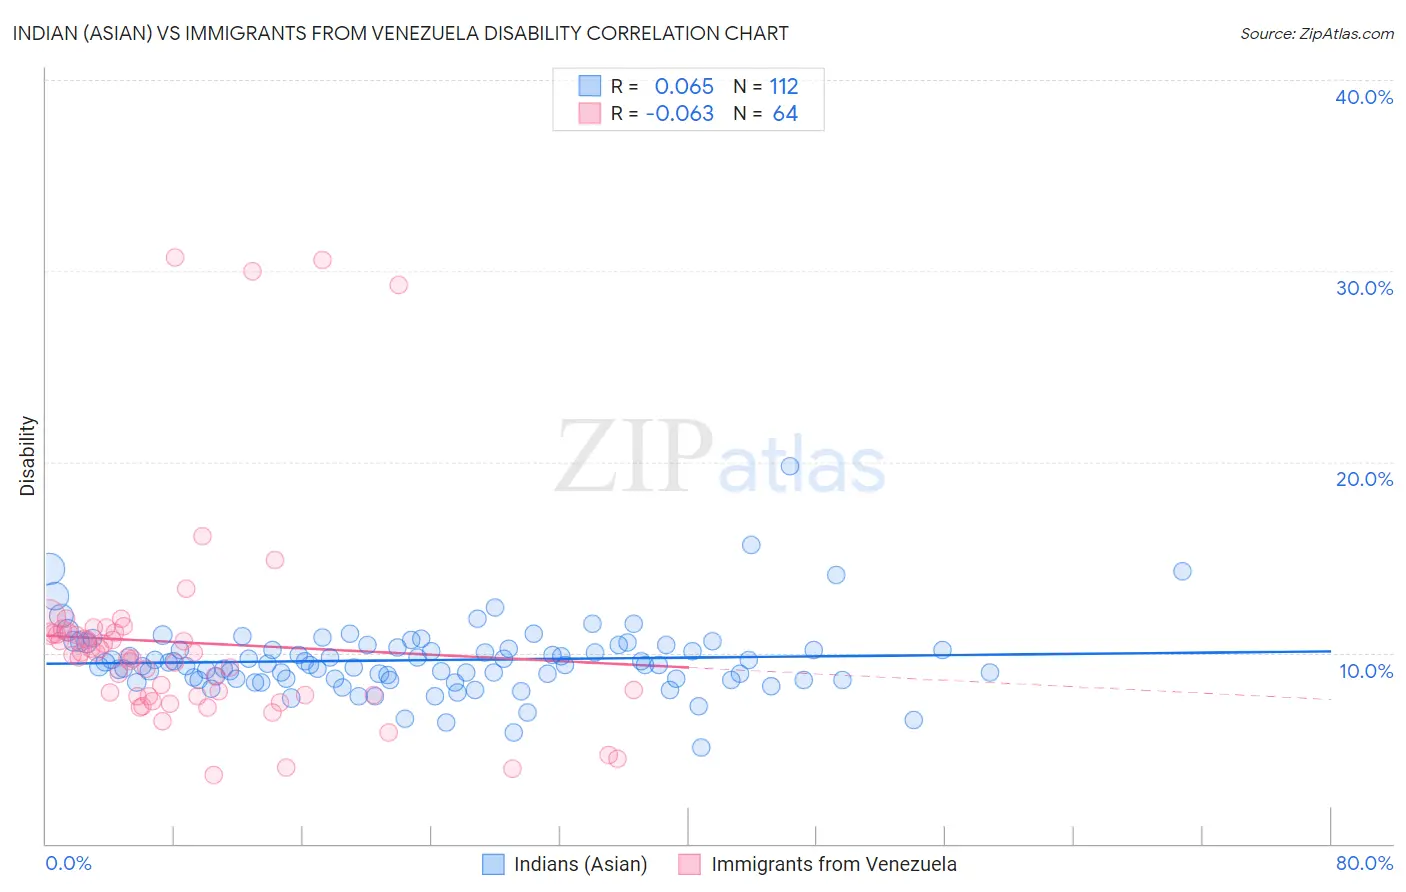
Indian (Asian) vs Immigrants from Venezuela Disability Correlation Chart
The statistical analysis conducted on geographies consisting of 495,278,900 people shows a slight positive correlation between the proportion of Indians (Asian) and percentage of population with a disability in the United States with a correlation coefficient (R) of 0.065 and weighted average of 10.3%. Similarly, the statistical analysis conducted on geographies consisting of 287,858,715 people shows a slight negative correlation between the proportion of Immigrants from Venezuela and percentage of population with a disability in the United States with a correlation coefficient (R) of -0.063 and weighted average of 10.4%, a difference of 1.8%.
Disability Correlation Summary
| Measurement | Indian (Asian) | Immigrants from Venezuela |
| Minimum | 5.0% | 3.6% |
| Maximum | 19.7% | 30.7% |
| Range | 14.7% | 27.2% |
| Mean | 9.6% | 10.5% |
| Median | 9.4% | 9.8% |
| Interquartile 25% (IQ1) | 8.6% | 7.7% |
| Interquartile 75% (IQ3) | 10.3% | 11.0% |
| Interquartile Range (IQR) | 1.7% | 3.3% |
| Standard Deviation (Sample) | 1.9% | 5.6% |
| Standard Deviation (Population) | 1.9% | 5.6% |
Demographics Similar to Indians (Asian) and Immigrants from Venezuela by Disability
In terms of disability, the demographic groups most similar to Indians (Asian) are Okinawan (10.3%, a difference of 0.070%), Immigrants from Iran (10.3%, a difference of 0.070%), Immigrants from Korea (10.2%, a difference of 0.37%), Immigrants from Eastern Asia (10.2%, a difference of 0.98%), and Burmese (10.4%, a difference of 1.1%). Similarly, the demographic groups most similar to Immigrants from Venezuela are Asian (10.4%, a difference of 0.030%), Immigrants from Sri Lanka (10.5%, a difference of 0.13%), Immigrants from Pakistan (10.4%, a difference of 0.69%), Burmese (10.4%, a difference of 0.70%), and Immigrants from Asia (10.5%, a difference of 0.82%).
| Demographics | Rating | Rank | Disability |
| Bolivians | 100.0 /100 | #8 | Exceptional 10.0% |
| Immigrants | Hong Kong | 100.0 /100 | #9 | Exceptional 10.0% |
| Immigrants | China | 100.0 /100 | #10 | Exceptional 10.1% |
| Iranians | 100.0 /100 | #11 | Exceptional 10.1% |
| Immigrants | Israel | 100.0 /100 | #12 | Exceptional 10.1% |
| Immigrants | Eastern Asia | 100.0 /100 | #13 | Exceptional 10.2% |
| Immigrants | Korea | 100.0 /100 | #14 | Exceptional 10.2% |
| Okinawans | 100.0 /100 | #15 | Exceptional 10.3% |
| Indians (Asian) | 100.0 /100 | #16 | Exceptional 10.3% |
| Immigrants | Iran | 100.0 /100 | #17 | Exceptional 10.3% |
| Burmese | 100.0 /100 | #18 | Exceptional 10.4% |
| Immigrants | Pakistan | 100.0 /100 | #19 | Exceptional 10.4% |
| Immigrants | Venezuela | 100.0 /100 | #20 | Exceptional 10.4% |
| Asians | 100.0 /100 | #21 | Exceptional 10.4% |
| Immigrants | Sri Lanka | 100.0 /100 | #22 | Exceptional 10.5% |
| Immigrants | Asia | 100.0 /100 | #23 | Exceptional 10.5% |
| Venezuelans | 100.0 /100 | #24 | Exceptional 10.5% |
| Immigrants | Malaysia | 100.0 /100 | #25 | Exceptional 10.6% |
| Argentineans | 100.0 /100 | #26 | Exceptional 10.6% |
| Cypriots | 100.0 /100 | #27 | Exceptional 10.6% |
| Egyptians | 100.0 /100 | #28 | Exceptional 10.6% |