Bermudan vs Immigrants from Somalia Disability
COMPARE
Bermudan
Immigrants from Somalia
Disability
Disability Comparison
Bermudans
Immigrants from Somalia
12.3%
DISABILITY
1.1/ 100
METRIC RATING
252nd/ 347
METRIC RANK
12.0%
DISABILITY
6.8/ 100
METRIC RATING
214th/ 347
METRIC RANK
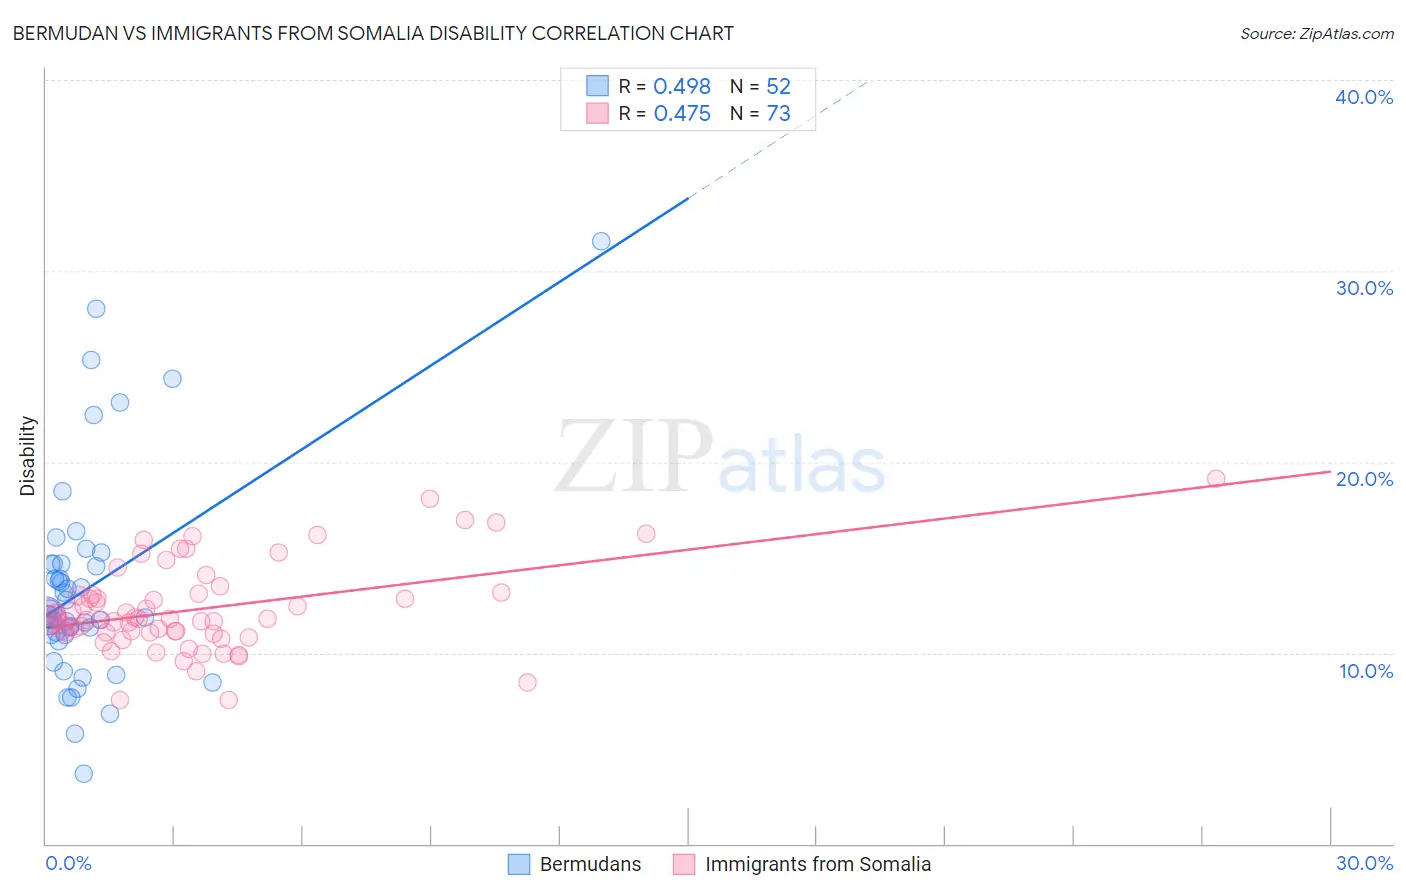
Bermudan vs Immigrants from Somalia Disability Correlation Chart
The statistical analysis conducted on geographies consisting of 55,721,549 people shows a moderate positive correlation between the proportion of Bermudans and percentage of population with a disability in the United States with a correlation coefficient (R) of 0.498 and weighted average of 12.3%. Similarly, the statistical analysis conducted on geographies consisting of 92,105,363 people shows a moderate positive correlation between the proportion of Immigrants from Somalia and percentage of population with a disability in the United States with a correlation coefficient (R) of 0.475 and weighted average of 12.0%, a difference of 2.0%.
Disability Correlation Summary
| Measurement | Bermudan | Immigrants from Somalia |
| Minimum | 3.7% | 7.5% |
| Maximum | 31.6% | 19.1% |
| Range | 27.9% | 11.6% |
| Mean | 13.4% | 12.3% |
| Median | 12.0% | 11.8% |
| Interquartile 25% (IQ1) | 10.9% | 11.1% |
| Interquartile 75% (IQ3) | 14.7% | 13.1% |
| Interquartile Range (IQR) | 3.7% | 2.0% |
| Standard Deviation (Sample) | 5.4% | 2.3% |
| Standard Deviation (Population) | 5.4% | 2.3% |
Similar Demographics by Disability
Demographics Similar to Bermudans by Disability
In terms of disability, the demographic groups most similar to Bermudans are Subsaharan African (12.3%, a difference of 0.19%), European (12.3%, a difference of 0.19%), Carpatho Rusyn (12.3%, a difference of 0.20%), Guamanian/Chamorro (12.3%, a difference of 0.21%), and Indonesian (12.2%, a difference of 0.25%).
| Demographics | Rating | Rank | Disability |
| Liberians | 1.5 /100 | #245 | Tragic 12.2% |
| Swiss | 1.5 /100 | #246 | Tragic 12.2% |
| Indonesians | 1.4 /100 | #247 | Tragic 12.2% |
| Guamanians/Chamorros | 1.4 /100 | #248 | Tragic 12.3% |
| Carpatho Rusyns | 1.4 /100 | #249 | Tragic 12.3% |
| Sub-Saharan Africans | 1.4 /100 | #250 | Tragic 12.3% |
| Europeans | 1.4 /100 | #251 | Tragic 12.3% |
| Bermudans | 1.1 /100 | #252 | Tragic 12.3% |
| Belgians | 0.8 /100 | #253 | Tragic 12.3% |
| German Russians | 0.8 /100 | #254 | Tragic 12.3% |
| Slovenes | 0.6 /100 | #255 | Tragic 12.4% |
| Immigrants | Dominica | 0.6 /100 | #256 | Tragic 12.4% |
| Immigrants | Laos | 0.5 /100 | #257 | Tragic 12.4% |
| Slavs | 0.5 /100 | #258 | Tragic 12.4% |
| Canadians | 0.4 /100 | #259 | Tragic 12.4% |
Demographics Similar to Immigrants from Somalia by Disability
In terms of disability, the demographic groups most similar to Immigrants from Somalia are Immigrants from Iraq (12.0%, a difference of 0.050%), Austrian (12.0%, a difference of 0.060%), Immigrants from Cambodia (12.0%, a difference of 0.080%), Immigrants from Canada (12.1%, a difference of 0.13%), and Czech (12.0%, a difference of 0.16%).
| Demographics | Rating | Rank | Disability |
| Immigrants | Thailand | 9.3 /100 | #207 | Tragic 12.0% |
| Immigrants | Caribbean | 9.1 /100 | #208 | Tragic 12.0% |
| Danes | 8.7 /100 | #209 | Tragic 12.0% |
| Czechs | 7.9 /100 | #210 | Tragic 12.0% |
| Immigrants | Cambodia | 7.3 /100 | #211 | Tragic 12.0% |
| Austrians | 7.2 /100 | #212 | Tragic 12.0% |
| Immigrants | Iraq | 7.1 /100 | #213 | Tragic 12.0% |
| Immigrants | Somalia | 6.8 /100 | #214 | Tragic 12.0% |
| Immigrants | Canada | 6.1 /100 | #215 | Tragic 12.1% |
| Panamanians | 5.4 /100 | #216 | Tragic 12.1% |
| Immigrants | North America | 5.3 /100 | #217 | Tragic 12.1% |
| Immigrants | Jamaica | 5.0 /100 | #218 | Tragic 12.1% |
| Croatians | 4.9 /100 | #219 | Tragic 12.1% |
| Immigrants | Bahamas | 4.7 /100 | #220 | Tragic 12.1% |
| Northern Europeans | 4.2 /100 | #221 | Tragic 12.1% |