Immigrants from Sri Lanka vs Immigrants from Somalia Disability
COMPARE
Immigrants from Sri Lanka
Immigrants from Somalia
Disability
Disability Comparison
Immigrants from Sri Lanka
Immigrants from Somalia
10.5%
DISABILITY
100.0/ 100
METRIC RATING
22nd/ 347
METRIC RANK
12.0%
DISABILITY
6.8/ 100
METRIC RATING
214th/ 347
METRIC RANK
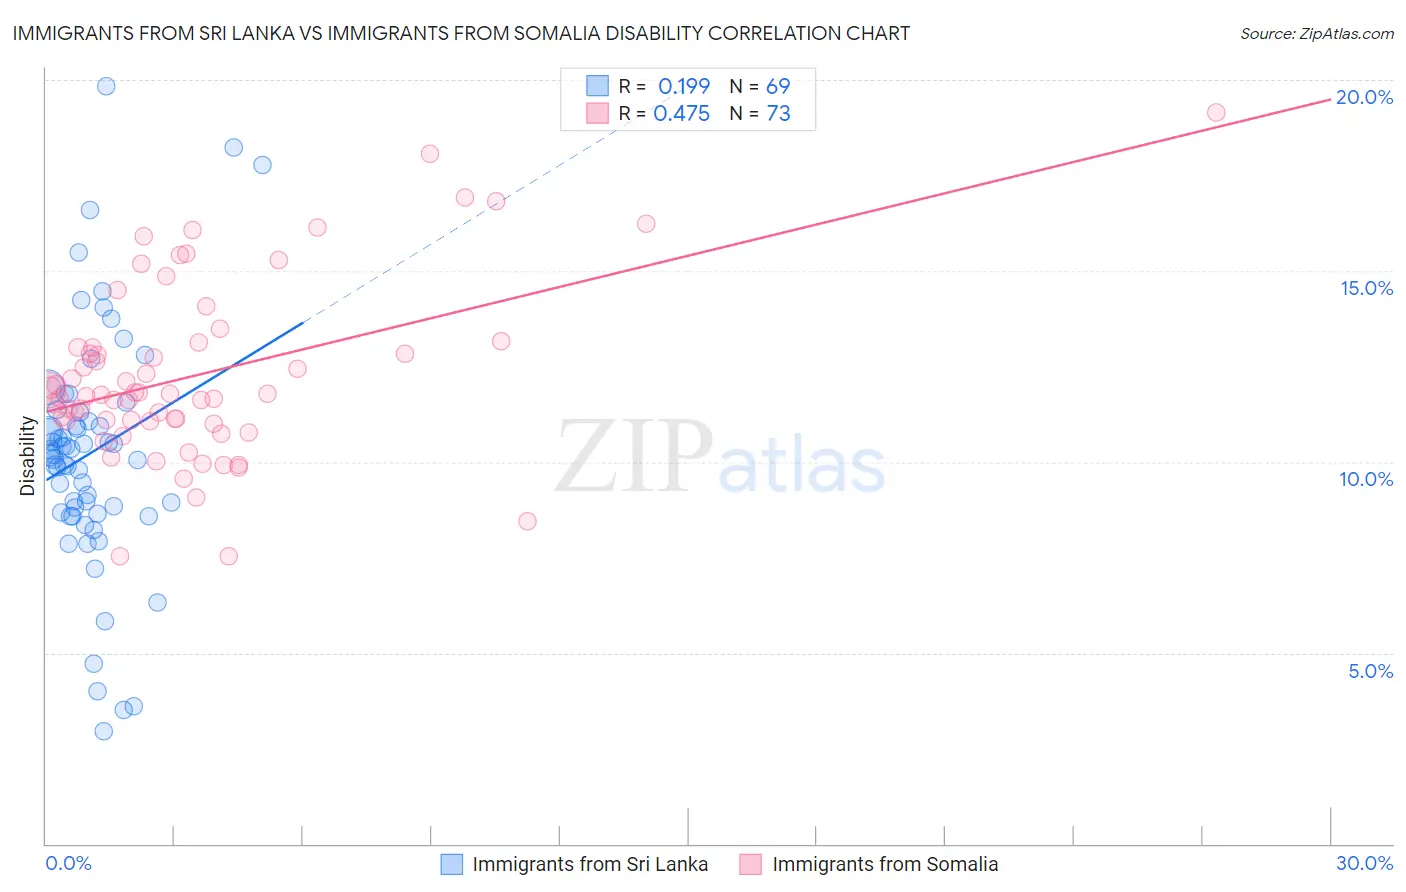
Immigrants from Sri Lanka vs Immigrants from Somalia Disability Correlation Chart
The statistical analysis conducted on geographies consisting of 149,700,552 people shows a poor positive correlation between the proportion of Immigrants from Sri Lanka and percentage of population with a disability in the United States with a correlation coefficient (R) of 0.199 and weighted average of 10.5%. Similarly, the statistical analysis conducted on geographies consisting of 92,105,363 people shows a moderate positive correlation between the proportion of Immigrants from Somalia and percentage of population with a disability in the United States with a correlation coefficient (R) of 0.475 and weighted average of 12.0%, a difference of 15.1%.
Disability Correlation Summary
| Measurement | Immigrants from Sri Lanka | Immigrants from Somalia |
| Minimum | 2.9% | 7.5% |
| Maximum | 19.8% | 19.1% |
| Range | 16.9% | 11.6% |
| Mean | 10.2% | 12.3% |
| Median | 10.2% | 11.8% |
| Interquartile 25% (IQ1) | 8.7% | 11.1% |
| Interquartile 75% (IQ3) | 11.3% | 13.1% |
| Interquartile Range (IQR) | 2.7% | 2.0% |
| Standard Deviation (Sample) | 3.2% | 2.3% |
| Standard Deviation (Population) | 3.2% | 2.3% |
Similar Demographics by Disability
Demographics Similar to Immigrants from Sri Lanka by Disability
In terms of disability, the demographic groups most similar to Immigrants from Sri Lanka are Asian (10.4%, a difference of 0.10%), Immigrants from Venezuela (10.4%, a difference of 0.13%), Immigrants from Asia (10.5%, a difference of 0.69%), Immigrants from Pakistan (10.4%, a difference of 0.82%), and Burmese (10.4%, a difference of 0.83%).
| Demographics | Rating | Rank | Disability |
| Okinawans | 100.0 /100 | #15 | Exceptional 10.3% |
| Indians (Asian) | 100.0 /100 | #16 | Exceptional 10.3% |
| Immigrants | Iran | 100.0 /100 | #17 | Exceptional 10.3% |
| Burmese | 100.0 /100 | #18 | Exceptional 10.4% |
| Immigrants | Pakistan | 100.0 /100 | #19 | Exceptional 10.4% |
| Immigrants | Venezuela | 100.0 /100 | #20 | Exceptional 10.4% |
| Asians | 100.0 /100 | #21 | Exceptional 10.4% |
| Immigrants | Sri Lanka | 100.0 /100 | #22 | Exceptional 10.5% |
| Immigrants | Asia | 100.0 /100 | #23 | Exceptional 10.5% |
| Venezuelans | 100.0 /100 | #24 | Exceptional 10.5% |
| Immigrants | Malaysia | 100.0 /100 | #25 | Exceptional 10.6% |
| Argentineans | 100.0 /100 | #26 | Exceptional 10.6% |
| Cypriots | 100.0 /100 | #27 | Exceptional 10.6% |
| Egyptians | 100.0 /100 | #28 | Exceptional 10.6% |
| Immigrants | Argentina | 100.0 /100 | #29 | Exceptional 10.6% |
Demographics Similar to Immigrants from Somalia by Disability
In terms of disability, the demographic groups most similar to Immigrants from Somalia are Immigrants from Iraq (12.0%, a difference of 0.050%), Austrian (12.0%, a difference of 0.060%), Immigrants from Cambodia (12.0%, a difference of 0.080%), Immigrants from Canada (12.1%, a difference of 0.13%), and Czech (12.0%, a difference of 0.16%).
| Demographics | Rating | Rank | Disability |
| Immigrants | Thailand | 9.3 /100 | #207 | Tragic 12.0% |
| Immigrants | Caribbean | 9.1 /100 | #208 | Tragic 12.0% |
| Danes | 8.7 /100 | #209 | Tragic 12.0% |
| Czechs | 7.9 /100 | #210 | Tragic 12.0% |
| Immigrants | Cambodia | 7.3 /100 | #211 | Tragic 12.0% |
| Austrians | 7.2 /100 | #212 | Tragic 12.0% |
| Immigrants | Iraq | 7.1 /100 | #213 | Tragic 12.0% |
| Immigrants | Somalia | 6.8 /100 | #214 | Tragic 12.0% |
| Immigrants | Canada | 6.1 /100 | #215 | Tragic 12.1% |
| Panamanians | 5.4 /100 | #216 | Tragic 12.1% |
| Immigrants | North America | 5.3 /100 | #217 | Tragic 12.1% |
| Immigrants | Jamaica | 5.0 /100 | #218 | Tragic 12.1% |
| Croatians | 4.9 /100 | #219 | Tragic 12.1% |
| Immigrants | Bahamas | 4.7 /100 | #220 | Tragic 12.1% |
| Northern Europeans | 4.2 /100 | #221 | Tragic 12.1% |