Maltese vs Chippewa Disability
COMPARE
Maltese
Chippewa
Disability
Disability Comparison
Maltese
Chippewa
11.7%
DISABILITY
50.6/ 100
METRIC RATING
173rd/ 347
METRIC RANK
14.1%
DISABILITY
0.0/ 100
METRIC RATING
324th/ 347
METRIC RANK
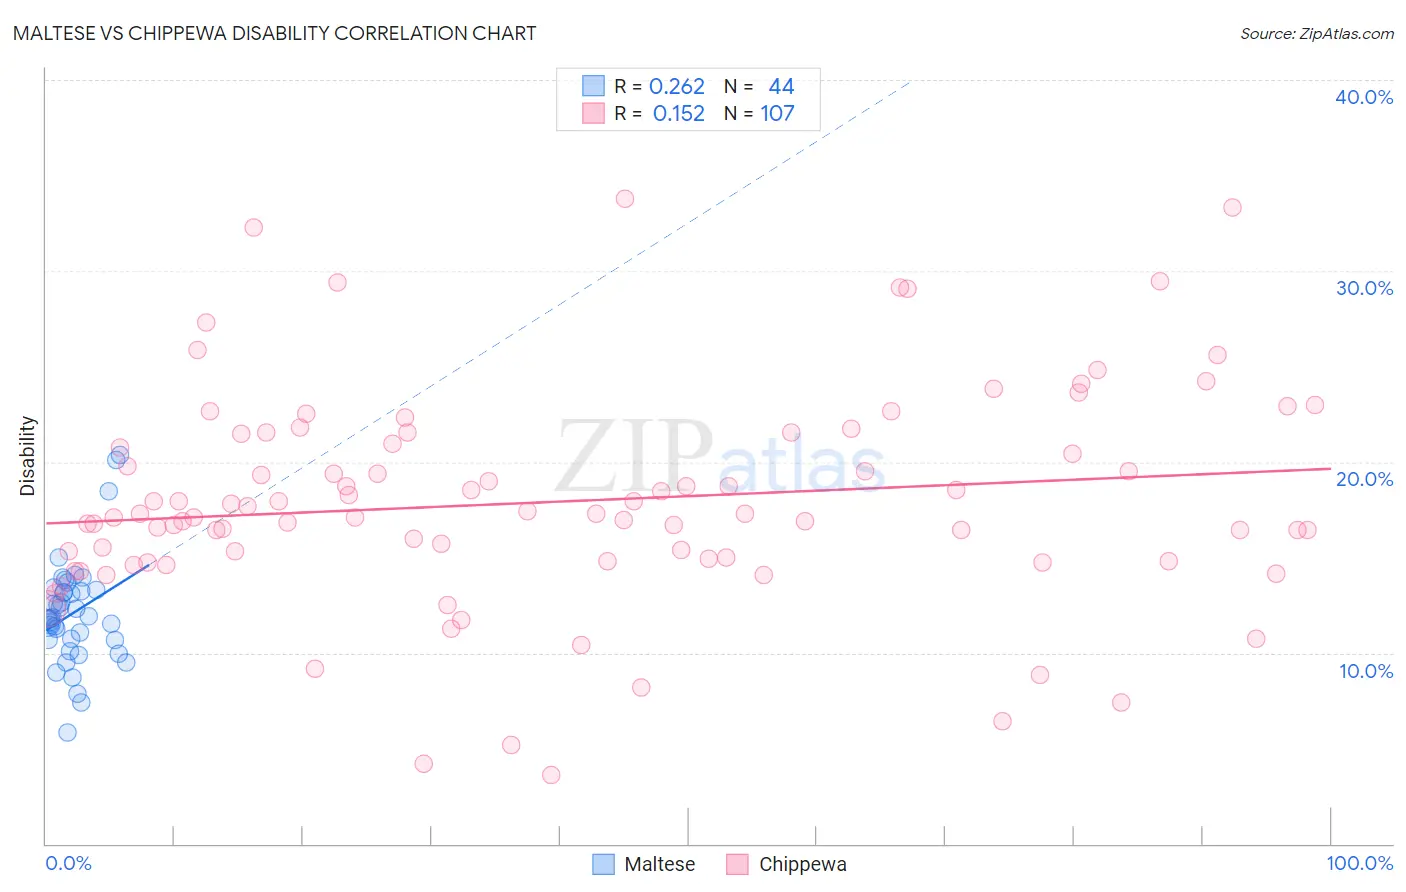
Maltese vs Chippewa Disability Correlation Chart
The statistical analysis conducted on geographies consisting of 126,476,999 people shows a weak positive correlation between the proportion of Maltese and percentage of population with a disability in the United States with a correlation coefficient (R) of 0.262 and weighted average of 11.7%. Similarly, the statistical analysis conducted on geographies consisting of 215,047,919 people shows a poor positive correlation between the proportion of Chippewa and percentage of population with a disability in the United States with a correlation coefficient (R) of 0.152 and weighted average of 14.1%, a difference of 20.9%.
Disability Correlation Summary
| Measurement | Maltese | Chippewa |
| Minimum | 5.8% | 3.6% |
| Maximum | 20.3% | 33.8% |
| Range | 14.5% | 30.2% |
| Mean | 12.1% | 17.9% |
| Median | 11.8% | 17.3% |
| Interquartile 25% (IQ1) | 10.7% | 14.8% |
| Interquartile 75% (IQ3) | 13.3% | 21.5% |
| Interquartile Range (IQR) | 2.6% | 6.7% |
| Standard Deviation (Sample) | 2.8% | 5.7% |
| Standard Deviation (Population) | 2.8% | 5.7% |
Similar Demographics by Disability
Demographics Similar to Maltese by Disability
In terms of disability, the demographic groups most similar to Maltese are Albanian (11.7%, a difference of 0.030%), Trinidadian and Tobagonian (11.7%, a difference of 0.090%), Haitian (11.7%, a difference of 0.090%), Immigrants from Albania (11.7%, a difference of 0.10%), and Immigrants from Southern Europe (11.7%, a difference of 0.10%).
| Demographics | Rating | Rank | Disability |
| Pakistanis | 54.7 /100 | #166 | Average 11.7% |
| Estonians | 54.4 /100 | #167 | Average 11.7% |
| Immigrants | Latin America | 54.1 /100 | #168 | Average 11.7% |
| Immigrants | Austria | 53.4 /100 | #169 | Average 11.7% |
| Immigrants | Albania | 52.8 /100 | #170 | Average 11.7% |
| Immigrants | Southern Europe | 52.8 /100 | #171 | Average 11.7% |
| Trinidadians and Tobagonians | 52.7 /100 | #172 | Average 11.7% |
| Maltese | 50.6 /100 | #173 | Average 11.7% |
| Albanians | 50.0 /100 | #174 | Average 11.7% |
| Haitians | 48.6 /100 | #175 | Average 11.7% |
| Immigrants | Western Africa | 47.5 /100 | #176 | Average 11.7% |
| Immigrants | Central America | 46.6 /100 | #177 | Average 11.7% |
| Greeks | 46.2 /100 | #178 | Average 11.7% |
| Immigrants | Armenia | 41.9 /100 | #179 | Average 11.7% |
| Immigrants | Honduras | 37.8 /100 | #180 | Fair 11.8% |
Demographics Similar to Chippewa by Disability
In terms of disability, the demographic groups most similar to Chippewa are Native/Alaskan (14.2%, a difference of 0.050%), Osage (14.2%, a difference of 0.080%), Ottawa (14.2%, a difference of 0.10%), Immigrants from the Azores (14.2%, a difference of 0.10%), and Comanche (14.1%, a difference of 0.20%).
| Demographics | Rating | Rank | Disability |
| Immigrants | Cabo Verde | 0.0 /100 | #317 | Tragic 13.7% |
| Menominee | 0.0 /100 | #318 | Tragic 13.8% |
| Iroquois | 0.0 /100 | #319 | Tragic 13.8% |
| Apache | 0.0 /100 | #320 | Tragic 13.9% |
| Paiute | 0.0 /100 | #321 | Tragic 13.9% |
| Americans | 0.0 /100 | #322 | Tragic 13.9% |
| Comanche | 0.0 /100 | #323 | Tragic 14.1% |
| Chippewa | 0.0 /100 | #324 | Tragic 14.1% |
| Natives/Alaskans | 0.0 /100 | #325 | Tragic 14.2% |
| Osage | 0.0 /100 | #326 | Tragic 14.2% |
| Ottawa | 0.0 /100 | #327 | Tragic 14.2% |
| Immigrants | Azores | 0.0 /100 | #328 | Tragic 14.2% |
| Potawatomi | 0.0 /100 | #329 | Tragic 14.2% |
| Navajo | 0.0 /100 | #330 | Tragic 14.3% |
| Alaskan Athabascans | 0.0 /100 | #331 | Tragic 14.4% |