Maltese vs Austrian Self-Care Disability
COMPARE
Maltese
Austrian
Self-Care Disability
Self-Care Disability Comparison
Maltese
Austrians
2.5%
SELF-CARE DISABILITY
37.5/ 100
METRIC RATING
182nd/ 347
METRIC RANK
2.4%
SELF-CARE DISABILITY
87.0/ 100
METRIC RATING
137th/ 347
METRIC RANK
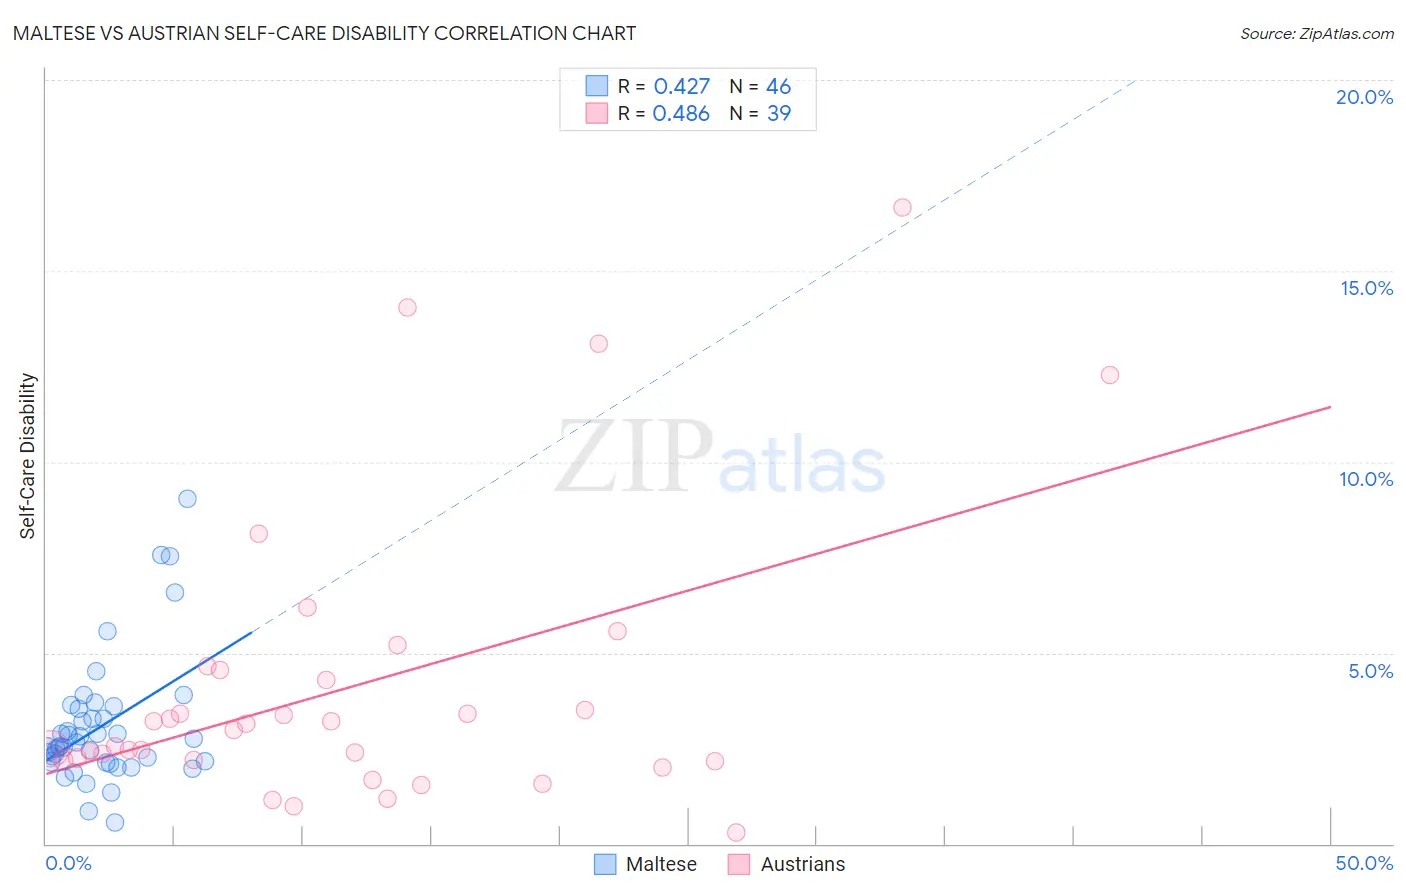
Maltese vs Austrian Self-Care Disability Correlation Chart
The statistical analysis conducted on geographies consisting of 126,446,361 people shows a moderate positive correlation between the proportion of Maltese and percentage of population with self-care disability in the United States with a correlation coefficient (R) of 0.427 and weighted average of 2.5%. Similarly, the statistical analysis conducted on geographies consisting of 451,319,038 people shows a moderate positive correlation between the proportion of Austrians and percentage of population with self-care disability in the United States with a correlation coefficient (R) of 0.486 and weighted average of 2.4%, a difference of 2.9%.
Self-Care Disability Correlation Summary
| Measurement | Maltese | Austrian |
| Minimum | 0.56% | 0.31% |
| Maximum | 9.0% | 16.7% |
| Range | 8.5% | 16.4% |
| Mean | 3.1% | 4.1% |
| Median | 2.6% | 3.0% |
| Interquartile 25% (IQ1) | 2.1% | 2.2% |
| Interquartile 75% (IQ3) | 3.5% | 4.6% |
| Interquartile Range (IQR) | 1.4% | 2.4% |
| Standard Deviation (Sample) | 1.7% | 3.7% |
| Standard Deviation (Population) | 1.7% | 3.7% |
Similar Demographics by Self-Care Disability
Demographics Similar to Maltese by Self-Care Disability
In terms of self-care disability, the demographic groups most similar to Maltese are Salvadoran (2.5%, a difference of 0.050%), Yugoslavian (2.5%, a difference of 0.070%), Ghanaian (2.5%, a difference of 0.14%), Slavic (2.5%, a difference of 0.16%), and Indonesian (2.5%, a difference of 0.19%).
| Demographics | Rating | Rank | Self-Care Disability |
| Immigrants | Bosnia and Herzegovina | 49.6 /100 | #175 | Average 2.5% |
| Immigrants | Afghanistan | 47.6 /100 | #176 | Average 2.5% |
| Immigrants | Kazakhstan | 46.7 /100 | #177 | Average 2.5% |
| English | 46.2 /100 | #178 | Average 2.5% |
| Hungarians | 45.5 /100 | #179 | Average 2.5% |
| Indonesians | 41.2 /100 | #180 | Average 2.5% |
| Ghanaians | 40.4 /100 | #181 | Average 2.5% |
| Maltese | 37.5 /100 | #182 | Fair 2.5% |
| Salvadorans | 36.4 /100 | #183 | Fair 2.5% |
| Yugoslavians | 36.1 /100 | #184 | Fair 2.5% |
| Slavs | 34.3 /100 | #185 | Fair 2.5% |
| Immigrants | El Salvador | 33.0 /100 | #186 | Fair 2.5% |
| Irish | 28.7 /100 | #187 | Fair 2.5% |
| Immigrants | Oceania | 28.3 /100 | #188 | Fair 2.5% |
| Immigrants | Eastern Europe | 28.0 /100 | #189 | Fair 2.5% |
Demographics Similar to Austrians by Self-Care Disability
In terms of self-care disability, the demographic groups most similar to Austrians are South American Indian (2.4%, a difference of 0.020%), Immigrants from Croatia (2.4%, a difference of 0.050%), Sri Lankan (2.4%, a difference of 0.050%), Laotian (2.4%, a difference of 0.080%), and Russian (2.4%, a difference of 0.14%).
| Demographics | Rating | Rank | Self-Care Disability |
| Immigrants | Austria | 89.0 /100 | #130 | Excellent 2.4% |
| Poles | 88.9 /100 | #131 | Excellent 2.4% |
| Immigrants | South America | 88.8 /100 | #132 | Excellent 2.4% |
| Immigrants | Colombia | 88.5 /100 | #133 | Excellent 2.4% |
| Russians | 88.2 /100 | #134 | Excellent 2.4% |
| Laotians | 87.8 /100 | #135 | Excellent 2.4% |
| South American Indians | 87.2 /100 | #136 | Excellent 2.4% |
| Austrians | 87.0 /100 | #137 | Excellent 2.4% |
| Immigrants | Croatia | 86.6 /100 | #138 | Excellent 2.4% |
| Sri Lankans | 86.6 /100 | #139 | Excellent 2.4% |
| Immigrants | Uruguay | 85.4 /100 | #140 | Excellent 2.4% |
| Alaska Natives | 84.5 /100 | #141 | Excellent 2.4% |
| Immigrants | Peru | 83.2 /100 | #142 | Excellent 2.4% |
| Afghans | 82.3 /100 | #143 | Excellent 2.4% |
| Costa Ricans | 80.8 /100 | #144 | Excellent 2.4% |