Maltese vs Immigrants from Nigeria Vision Disability
COMPARE
Maltese
Immigrants from Nigeria
Vision Disability
Vision Disability Comparison
Maltese
Immigrants from Nigeria
2.0%
VISION DISABILITY
98.9/ 100
METRIC RATING
65th/ 347
METRIC RANK
2.2%
VISION DISABILITY
13.5/ 100
METRIC RATING
207th/ 347
METRIC RANK
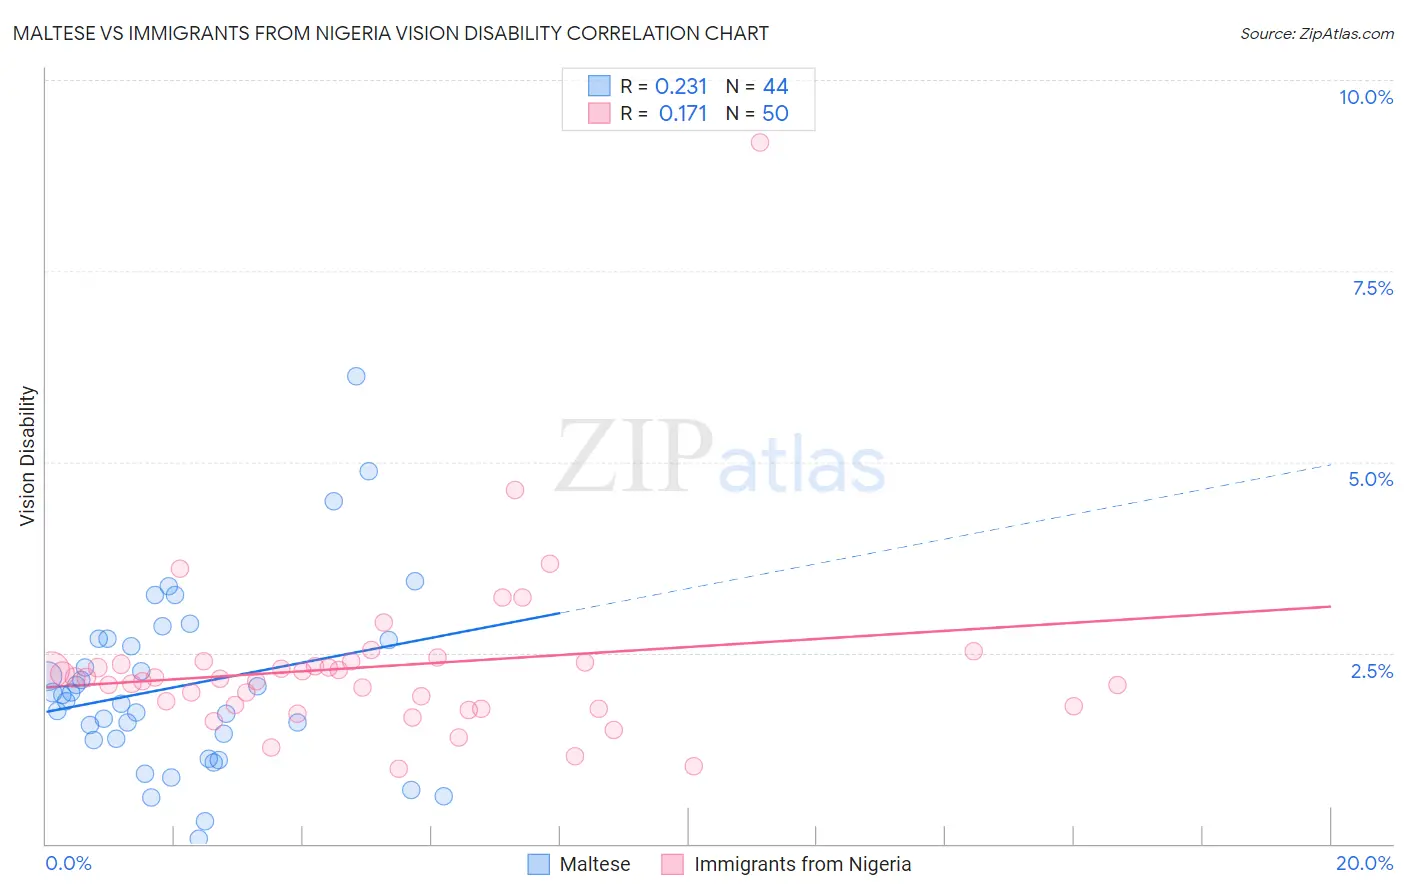
Maltese vs Immigrants from Nigeria Vision Disability Correlation Chart
The statistical analysis conducted on geographies consisting of 126,445,167 people shows a weak positive correlation between the proportion of Maltese and percentage of population with vision disability in the United States with a correlation coefficient (R) of 0.231 and weighted average of 2.0%. Similarly, the statistical analysis conducted on geographies consisting of 283,383,362 people shows a poor positive correlation between the proportion of Immigrants from Nigeria and percentage of population with vision disability in the United States with a correlation coefficient (R) of 0.171 and weighted average of 2.2%, a difference of 10.8%.
Vision Disability Correlation Summary
| Measurement | Maltese | Immigrants from Nigeria |
| Minimum | 0.070% | 0.98% |
| Maximum | 6.1% | 9.2% |
| Range | 6.0% | 8.2% |
| Mean | 2.1% | 2.3% |
| Median | 1.9% | 2.2% |
| Interquartile 25% (IQ1) | 1.4% | 1.8% |
| Interquartile 75% (IQ3) | 2.7% | 2.4% |
| Interquartile Range (IQR) | 1.3% | 0.58% |
| Standard Deviation (Sample) | 1.2% | 1.2% |
| Standard Deviation (Population) | 1.2% | 1.2% |
Similar Demographics by Vision Disability
Demographics Similar to Maltese by Vision Disability
In terms of vision disability, the demographic groups most similar to Maltese are Immigrants from Argentina (2.0%, a difference of 0.060%), Immigrants from Greece (2.0%, a difference of 0.070%), Immigrants from Northern Africa (2.0%, a difference of 0.17%), Armenian (2.0%, a difference of 0.20%), and Immigrants from Czechoslovakia (2.0%, a difference of 0.27%).
| Demographics | Rating | Rank | Vision Disability |
| Immigrants | Saudi Arabia | 99.2 /100 | #58 | Exceptional 2.0% |
| Argentineans | 99.1 /100 | #59 | Exceptional 2.0% |
| Immigrants | Romania | 99.1 /100 | #60 | Exceptional 2.0% |
| Immigrants | Belgium | 99.1 /100 | #61 | Exceptional 2.0% |
| Immigrants | Russia | 99.1 /100 | #62 | Exceptional 2.0% |
| Armenians | 99.0 /100 | #63 | Exceptional 2.0% |
| Immigrants | Greece | 99.0 /100 | #64 | Exceptional 2.0% |
| Maltese | 98.9 /100 | #65 | Exceptional 2.0% |
| Immigrants | Argentina | 98.9 /100 | #66 | Exceptional 2.0% |
| Immigrants | Northern Africa | 98.8 /100 | #67 | Exceptional 2.0% |
| Immigrants | Czechoslovakia | 98.7 /100 | #68 | Exceptional 2.0% |
| Russians | 98.6 /100 | #69 | Exceptional 2.0% |
| Immigrants | Kazakhstan | 98.6 /100 | #70 | Exceptional 2.0% |
| Immigrants | Northern Europe | 98.6 /100 | #71 | Exceptional 2.0% |
| Immigrants | France | 98.5 /100 | #72 | Exceptional 2.0% |
Demographics Similar to Immigrants from Nigeria by Vision Disability
In terms of vision disability, the demographic groups most similar to Immigrants from Nigeria are German (2.2%, a difference of 0.010%), Immigrants from Brazil (2.2%, a difference of 0.040%), Pennsylvania German (2.2%, a difference of 0.13%), Samoan (2.2%, a difference of 0.27%), and Immigrants from Uruguay (2.2%, a difference of 0.27%).
| Demographics | Rating | Rank | Vision Disability |
| Immigrants | Thailand | 20.1 /100 | #200 | Fair 2.2% |
| Slovaks | 18.8 /100 | #201 | Poor 2.2% |
| Immigrants | Zaire | 18.0 /100 | #202 | Poor 2.2% |
| Dutch | 17.1 /100 | #203 | Poor 2.2% |
| Immigrants | Guyana | 15.9 /100 | #204 | Poor 2.2% |
| Samoans | 15.7 /100 | #205 | Poor 2.2% |
| Pennsylvania Germans | 14.5 /100 | #206 | Poor 2.2% |
| Immigrants | Nigeria | 13.5 /100 | #207 | Poor 2.2% |
| Germans | 13.4 /100 | #208 | Poor 2.2% |
| Immigrants | Brazil | 13.1 /100 | #209 | Poor 2.2% |
| Immigrants | Uruguay | 11.5 /100 | #210 | Poor 2.2% |
| Indonesians | 9.5 /100 | #211 | Tragic 2.2% |
| Bermudans | 9.0 /100 | #212 | Tragic 2.2% |
| Immigrants | Ghana | 8.9 /100 | #213 | Tragic 2.2% |
| Trinidadians and Tobagonians | 8.2 /100 | #214 | Tragic 2.2% |