Maltese vs Immigrants from Nigeria Cognitive Disability
COMPARE
Maltese
Immigrants from Nigeria
Cognitive Disability
Cognitive Disability Comparison
Maltese
Immigrants from Nigeria
16.2%
COGNITIVE DISABILITY
100.0/ 100
METRIC RATING
12th/ 347
METRIC RANK
18.0%
COGNITIVE DISABILITY
0.2/ 100
METRIC RATING
274th/ 347
METRIC RANK
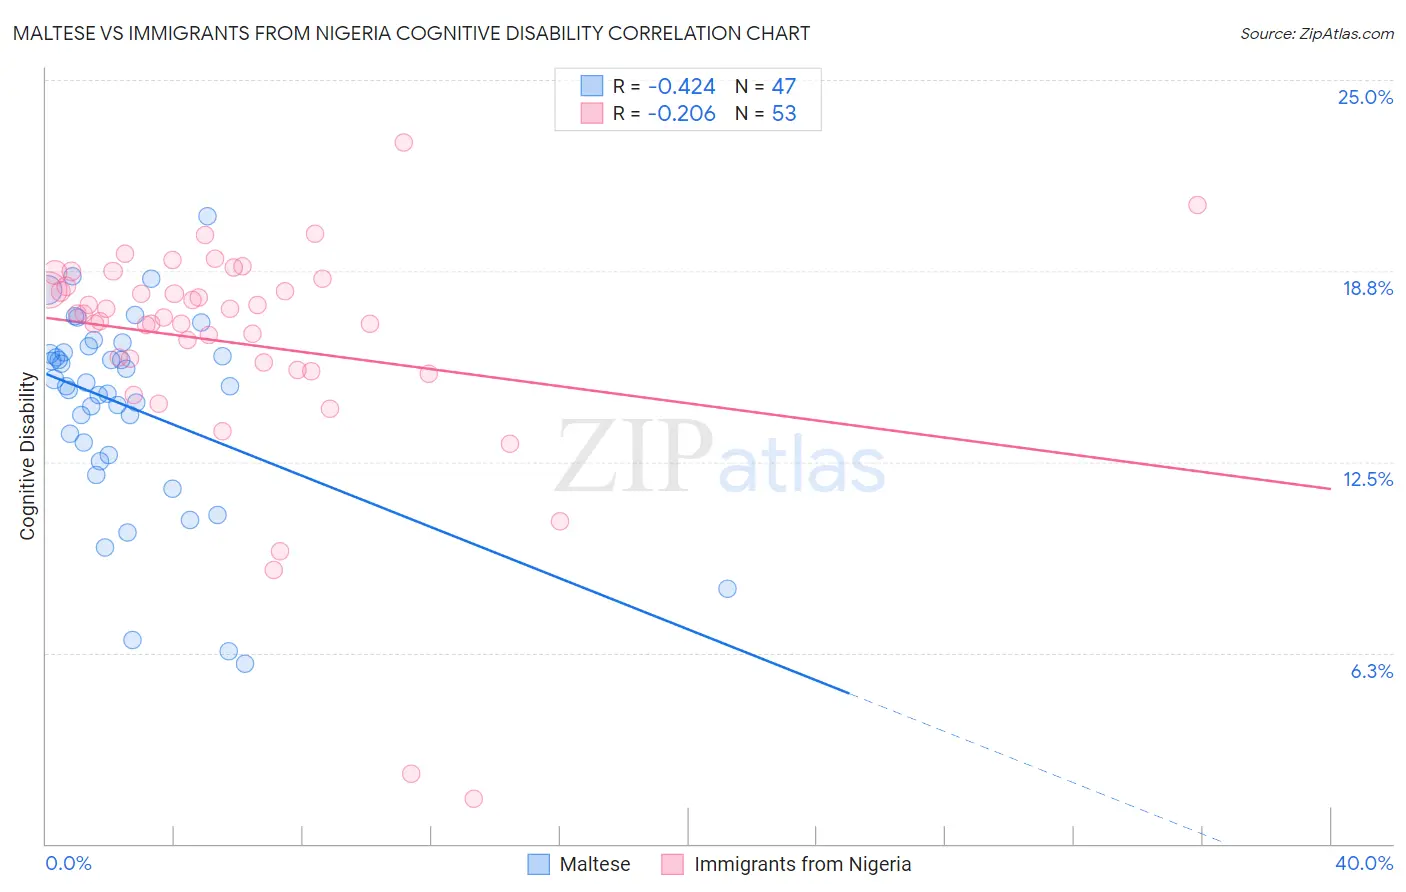
Maltese vs Immigrants from Nigeria Cognitive Disability Correlation Chart
The statistical analysis conducted on geographies consisting of 126,468,065 people shows a moderate negative correlation between the proportion of Maltese and percentage of population with cognitive disability in the United States with a correlation coefficient (R) of -0.424 and weighted average of 16.2%. Similarly, the statistical analysis conducted on geographies consisting of 283,477,063 people shows a weak negative correlation between the proportion of Immigrants from Nigeria and percentage of population with cognitive disability in the United States with a correlation coefficient (R) of -0.206 and weighted average of 18.0%, a difference of 11.1%.
Cognitive Disability Correlation Summary
| Measurement | Maltese | Immigrants from Nigeria |
| Minimum | 5.9% | 1.5% |
| Maximum | 20.5% | 23.0% |
| Range | 14.6% | 21.5% |
| Mean | 14.3% | 16.4% |
| Median | 15.0% | 17.3% |
| Interquartile 25% (IQ1) | 12.7% | 15.6% |
| Interquartile 75% (IQ3) | 16.1% | 18.4% |
| Interquartile Range (IQR) | 3.4% | 2.7% |
| Standard Deviation (Sample) | 3.2% | 3.8% |
| Standard Deviation (Population) | 3.2% | 3.8% |
Similar Demographics by Cognitive Disability
Demographics Similar to Maltese by Cognitive Disability
In terms of cognitive disability, the demographic groups most similar to Maltese are Lithuanian (16.3%, a difference of 0.090%), Immigrants from Austria (16.3%, a difference of 0.15%), Immigrants from Czechoslovakia (16.2%, a difference of 0.16%), Immigrants from Greece (16.3%, a difference of 0.18%), and Immigrants from Scotland (16.2%, a difference of 0.25%).
| Demographics | Rating | Rank | Cognitive Disability |
| Immigrants | Hong Kong | 100.0 /100 | #5 | Exceptional 16.0% |
| Thais | 100.0 /100 | #6 | Exceptional 16.1% |
| Immigrants | Ireland | 100.0 /100 | #7 | Exceptional 16.1% |
| Immigrants | Poland | 100.0 /100 | #8 | Exceptional 16.1% |
| Assyrians/Chaldeans/Syriacs | 100.0 /100 | #9 | Exceptional 16.2% |
| Immigrants | Scotland | 100.0 /100 | #10 | Exceptional 16.2% |
| Immigrants | Czechoslovakia | 100.0 /100 | #11 | Exceptional 16.2% |
| Maltese | 100.0 /100 | #12 | Exceptional 16.2% |
| Lithuanians | 100.0 /100 | #13 | Exceptional 16.3% |
| Immigrants | Austria | 100.0 /100 | #14 | Exceptional 16.3% |
| Immigrants | Greece | 100.0 /100 | #15 | Exceptional 16.3% |
| Eastern Europeans | 100.0 /100 | #16 | Exceptional 16.3% |
| Immigrants | North Macedonia | 100.0 /100 | #17 | Exceptional 16.3% |
| Immigrants | Northern Europe | 100.0 /100 | #18 | Exceptional 16.3% |
| Immigrants | Bolivia | 100.0 /100 | #19 | Exceptional 16.3% |
Demographics Similar to Immigrants from Nigeria by Cognitive Disability
In terms of cognitive disability, the demographic groups most similar to Immigrants from Nigeria are Immigrants from Nepal (18.0%, a difference of 0.010%), Immigrants from Laos (18.1%, a difference of 0.10%), Immigrants from Honduras (18.0%, a difference of 0.13%), Potawatomi (18.0%, a difference of 0.14%), and Yuman (18.1%, a difference of 0.15%).
| Demographics | Rating | Rank | Cognitive Disability |
| Nepalese | 0.3 /100 | #267 | Tragic 18.0% |
| Cherokee | 0.3 /100 | #268 | Tragic 18.0% |
| Hondurans | 0.3 /100 | #269 | Tragic 18.0% |
| Immigrants | Bahamas | 0.3 /100 | #270 | Tragic 18.0% |
| Potawatomi | 0.2 /100 | #271 | Tragic 18.0% |
| Immigrants | Honduras | 0.2 /100 | #272 | Tragic 18.0% |
| Immigrants | Nepal | 0.2 /100 | #273 | Tragic 18.0% |
| Immigrants | Nigeria | 0.2 /100 | #274 | Tragic 18.0% |
| Immigrants | Laos | 0.2 /100 | #275 | Tragic 18.1% |
| Yuman | 0.2 /100 | #276 | Tragic 18.1% |
| Immigrants | Kuwait | 0.2 /100 | #277 | Tragic 18.1% |
| Immigrants | Micronesia | 0.2 /100 | #278 | Tragic 18.1% |
| Chippewa | 0.1 /100 | #279 | Tragic 18.1% |
| West Indians | 0.1 /100 | #280 | Tragic 18.1% |
| Yakama | 0.1 /100 | #281 | Tragic 18.1% |