Tohono O'odham vs Immigrants from Nigeria Vision Disability
COMPARE
Tohono O'odham
Immigrants from Nigeria
Vision Disability
Vision Disability Comparison
Tohono O'odham
Immigrants from Nigeria
2.8%
VISION DISABILITY
0.0/ 100
METRIC RATING
319th/ 347
METRIC RANK
2.2%
VISION DISABILITY
13.5/ 100
METRIC RATING
207th/ 347
METRIC RANK
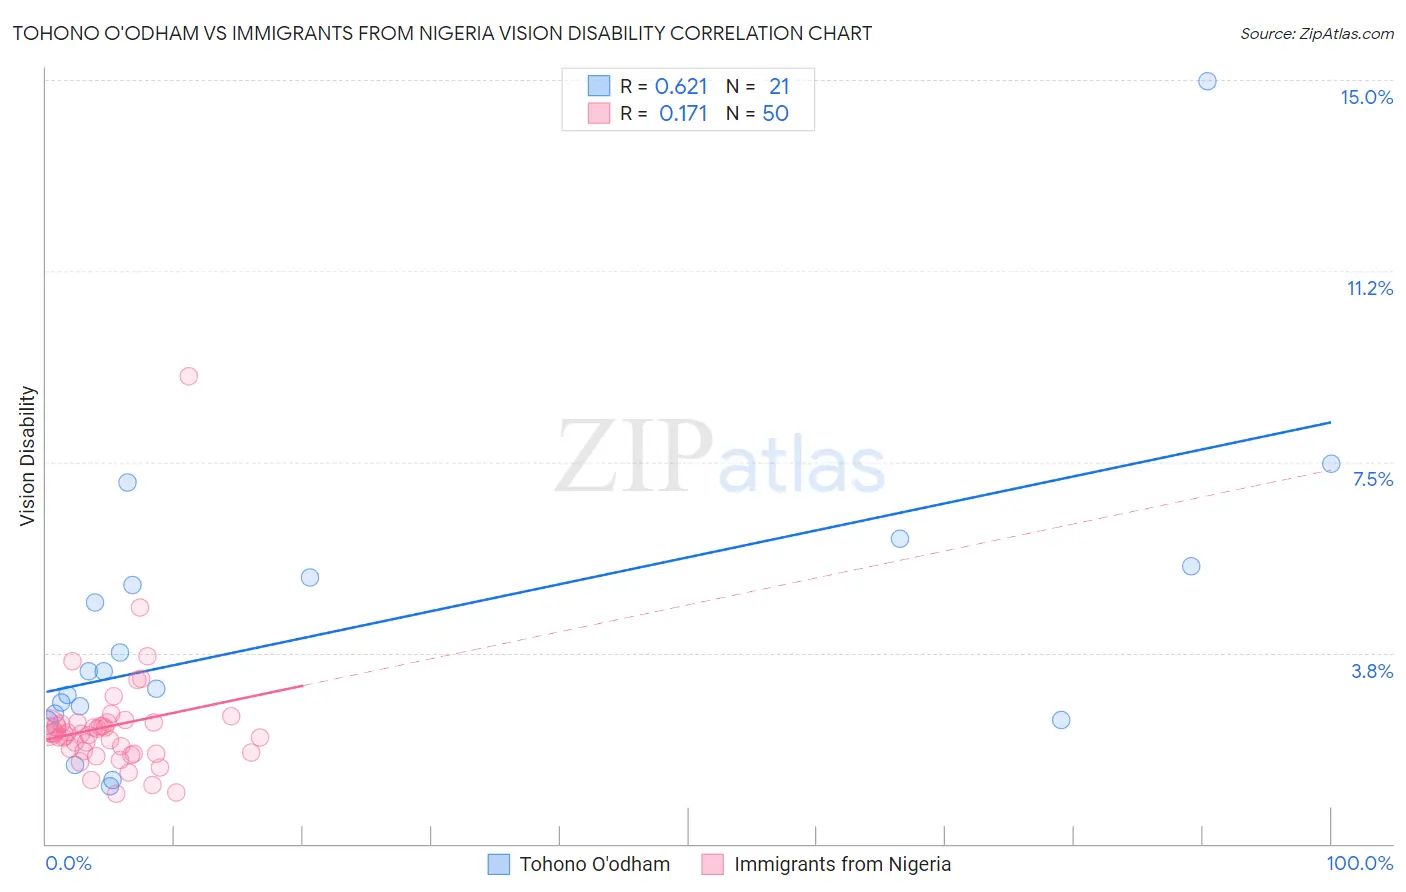
Tohono O'odham vs Immigrants from Nigeria Vision Disability Correlation Chart
The statistical analysis conducted on geographies consisting of 58,710,192 people shows a significant positive correlation between the proportion of Tohono O'odham and percentage of population with vision disability in the United States with a correlation coefficient (R) of 0.621 and weighted average of 2.8%. Similarly, the statistical analysis conducted on geographies consisting of 283,383,362 people shows a poor positive correlation between the proportion of Immigrants from Nigeria and percentage of population with vision disability in the United States with a correlation coefficient (R) of 0.171 and weighted average of 2.2%, a difference of 24.1%.
Vision Disability Correlation Summary
| Measurement | Tohono O'odham | Immigrants from Nigeria |
| Minimum | 1.1% | 0.98% |
| Maximum | 15.0% | 9.2% |
| Range | 13.8% | 8.2% |
| Mean | 4.2% | 2.3% |
| Median | 3.4% | 2.2% |
| Interquartile 25% (IQ1) | 2.5% | 1.8% |
| Interquartile 75% (IQ3) | 5.3% | 2.4% |
| Interquartile Range (IQR) | 2.8% | 0.58% |
| Standard Deviation (Sample) | 3.0% | 1.2% |
| Standard Deviation (Population) | 3.0% | 1.2% |
Similar Demographics by Vision Disability
Demographics Similar to Tohono O'odham by Vision Disability
In terms of vision disability, the demographic groups most similar to Tohono O'odham are Black/African American (2.8%, a difference of 0.69%), Alaska Native (2.7%, a difference of 1.4%), Yup'ik (2.7%, a difference of 2.5%), Comanche (2.8%, a difference of 2.7%), and Shoshone (2.7%, a difference of 2.7%).
| Demographics | Rating | Rank | Vision Disability |
| Americans | 0.0 /100 | #312 | Tragic 2.6% |
| Potawatomi | 0.0 /100 | #313 | Tragic 2.6% |
| Inupiat | 0.0 /100 | #314 | Tragic 2.7% |
| Osage | 0.0 /100 | #315 | Tragic 2.7% |
| Shoshone | 0.0 /100 | #316 | Tragic 2.7% |
| Yup'ik | 0.0 /100 | #317 | Tragic 2.7% |
| Alaska Natives | 0.0 /100 | #318 | Tragic 2.7% |
| Tohono O'odham | 0.0 /100 | #319 | Tragic 2.8% |
| Blacks/African Americans | 0.0 /100 | #320 | Tragic 2.8% |
| Comanche | 0.0 /100 | #321 | Tragic 2.8% |
| Paiute | 0.0 /100 | #322 | Tragic 2.9% |
| Tlingit-Haida | 0.0 /100 | #323 | Tragic 2.9% |
| Hopi | 0.0 /100 | #324 | Tragic 2.9% |
| Cherokee | 0.0 /100 | #325 | Tragic 2.9% |
| Spanish Americans | 0.0 /100 | #326 | Tragic 2.9% |
Demographics Similar to Immigrants from Nigeria by Vision Disability
In terms of vision disability, the demographic groups most similar to Immigrants from Nigeria are German (2.2%, a difference of 0.010%), Immigrants from Brazil (2.2%, a difference of 0.040%), Pennsylvania German (2.2%, a difference of 0.13%), Samoan (2.2%, a difference of 0.27%), and Immigrants from Uruguay (2.2%, a difference of 0.27%).
| Demographics | Rating | Rank | Vision Disability |
| Immigrants | Thailand | 20.1 /100 | #200 | Fair 2.2% |
| Slovaks | 18.8 /100 | #201 | Poor 2.2% |
| Immigrants | Zaire | 18.0 /100 | #202 | Poor 2.2% |
| Dutch | 17.1 /100 | #203 | Poor 2.2% |
| Immigrants | Guyana | 15.9 /100 | #204 | Poor 2.2% |
| Samoans | 15.7 /100 | #205 | Poor 2.2% |
| Pennsylvania Germans | 14.5 /100 | #206 | Poor 2.2% |
| Immigrants | Nigeria | 13.5 /100 | #207 | Poor 2.2% |
| Germans | 13.4 /100 | #208 | Poor 2.2% |
| Immigrants | Brazil | 13.1 /100 | #209 | Poor 2.2% |
| Immigrants | Uruguay | 11.5 /100 | #210 | Poor 2.2% |
| Indonesians | 9.5 /100 | #211 | Tragic 2.2% |
| Bermudans | 9.0 /100 | #212 | Tragic 2.2% |
| Immigrants | Ghana | 8.9 /100 | #213 | Tragic 2.2% |
| Trinidadians and Tobagonians | 8.2 /100 | #214 | Tragic 2.2% |