Fijian vs Immigrants from Nigeria Vision Disability
COMPARE
Fijian
Immigrants from Nigeria
Vision Disability
Vision Disability Comparison
Fijians
Immigrants from Nigeria
2.4%
VISION DISABILITY
0.1/ 100
METRIC RATING
261st/ 347
METRIC RANK
2.2%
VISION DISABILITY
13.5/ 100
METRIC RATING
207th/ 347
METRIC RANK
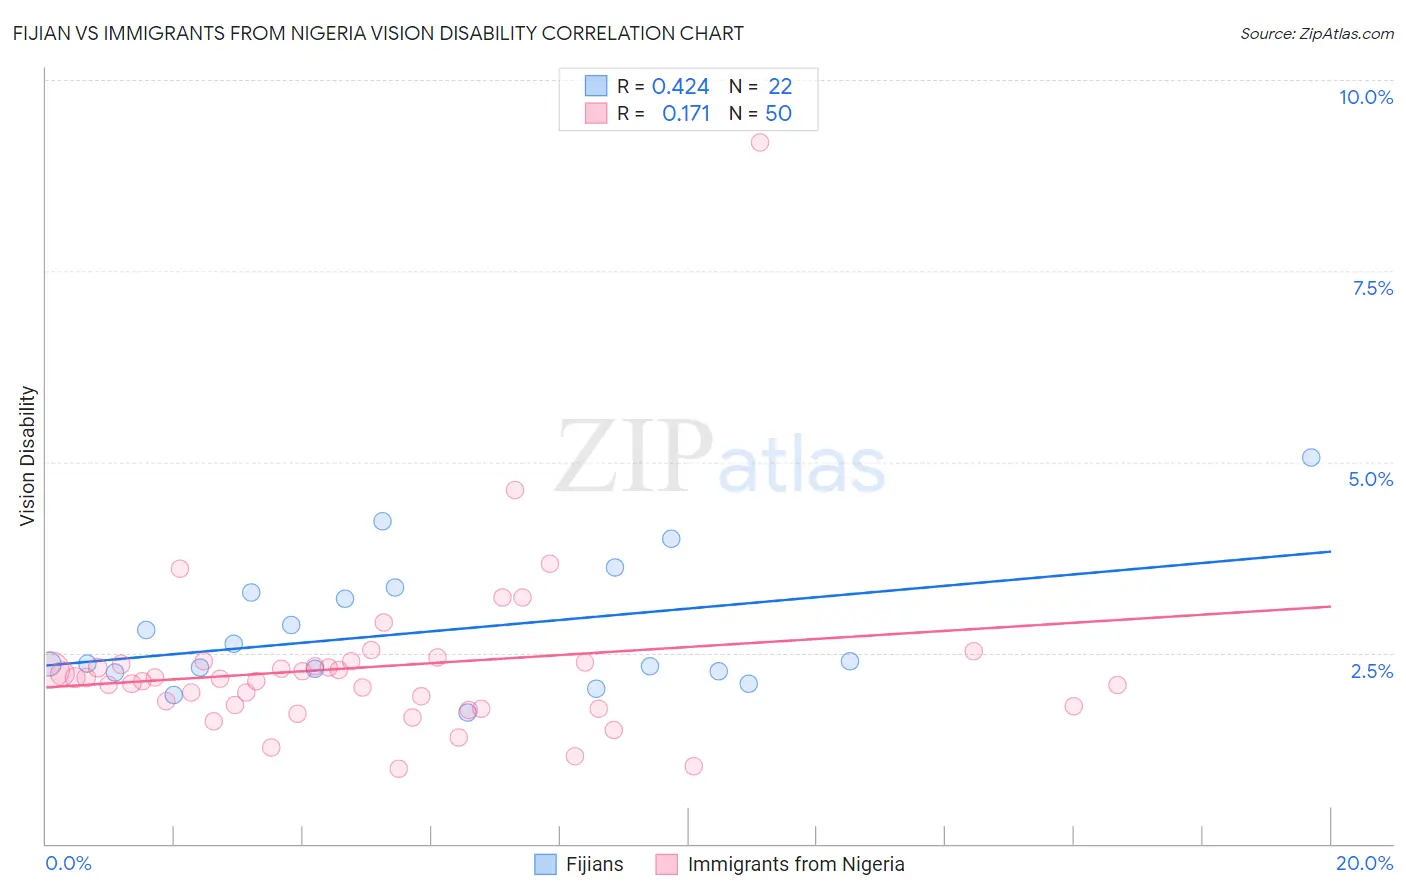
Fijian vs Immigrants from Nigeria Vision Disability Correlation Chart
The statistical analysis conducted on geographies consisting of 55,940,410 people shows a moderate positive correlation between the proportion of Fijians and percentage of population with vision disability in the United States with a correlation coefficient (R) of 0.424 and weighted average of 2.4%. Similarly, the statistical analysis conducted on geographies consisting of 283,383,362 people shows a poor positive correlation between the proportion of Immigrants from Nigeria and percentage of population with vision disability in the United States with a correlation coefficient (R) of 0.171 and weighted average of 2.2%, a difference of 7.1%.
Vision Disability Correlation Summary
| Measurement | Fijian | Immigrants from Nigeria |
| Minimum | 1.7% | 0.98% |
| Maximum | 5.1% | 9.2% |
| Range | 3.3% | 8.2% |
| Mean | 2.8% | 2.3% |
| Median | 2.4% | 2.2% |
| Interquartile 25% (IQ1) | 2.3% | 1.8% |
| Interquartile 75% (IQ3) | 3.3% | 2.4% |
| Interquartile Range (IQR) | 1.0% | 0.58% |
| Standard Deviation (Sample) | 0.84% | 1.2% |
| Standard Deviation (Population) | 0.82% | 1.2% |
Similar Demographics by Vision Disability
Demographics Similar to Fijians by Vision Disability
In terms of vision disability, the demographic groups most similar to Fijians are Jamaican (2.4%, a difference of 0.030%), Belizean (2.4%, a difference of 0.21%), Immigrants from Belize (2.4%, a difference of 0.28%), White/Caucasian (2.4%, a difference of 0.38%), and British West Indian (2.4%, a difference of 0.40%).
| Demographics | Rating | Rank | Vision Disability |
| Haitians | 0.3 /100 | #254 | Tragic 2.4% |
| Immigrants | Guatemala | 0.3 /100 | #255 | Tragic 2.4% |
| Immigrants | Haiti | 0.2 /100 | #256 | Tragic 2.4% |
| West Indians | 0.2 /100 | #257 | Tragic 2.4% |
| British West Indians | 0.2 /100 | #258 | Tragic 2.4% |
| Whites/Caucasians | 0.2 /100 | #259 | Tragic 2.4% |
| Belizeans | 0.2 /100 | #260 | Tragic 2.4% |
| Fijians | 0.1 /100 | #261 | Tragic 2.4% |
| Jamaicans | 0.1 /100 | #262 | Tragic 2.4% |
| Immigrants | Belize | 0.1 /100 | #263 | Tragic 2.4% |
| Immigrants | Liberia | 0.1 /100 | #264 | Tragic 2.4% |
| Immigrants | Jamaica | 0.1 /100 | #265 | Tragic 2.4% |
| Mexican American Indians | 0.1 /100 | #266 | Tragic 2.4% |
| Ute | 0.1 /100 | #267 | Tragic 2.4% |
| Senegalese | 0.1 /100 | #268 | Tragic 2.4% |
Demographics Similar to Immigrants from Nigeria by Vision Disability
In terms of vision disability, the demographic groups most similar to Immigrants from Nigeria are German (2.2%, a difference of 0.010%), Immigrants from Brazil (2.2%, a difference of 0.040%), Pennsylvania German (2.2%, a difference of 0.13%), Samoan (2.2%, a difference of 0.27%), and Immigrants from Uruguay (2.2%, a difference of 0.27%).
| Demographics | Rating | Rank | Vision Disability |
| Immigrants | Thailand | 20.1 /100 | #200 | Fair 2.2% |
| Slovaks | 18.8 /100 | #201 | Poor 2.2% |
| Immigrants | Zaire | 18.0 /100 | #202 | Poor 2.2% |
| Dutch | 17.1 /100 | #203 | Poor 2.2% |
| Immigrants | Guyana | 15.9 /100 | #204 | Poor 2.2% |
| Samoans | 15.7 /100 | #205 | Poor 2.2% |
| Pennsylvania Germans | 14.5 /100 | #206 | Poor 2.2% |
| Immigrants | Nigeria | 13.5 /100 | #207 | Poor 2.2% |
| Germans | 13.4 /100 | #208 | Poor 2.2% |
| Immigrants | Brazil | 13.1 /100 | #209 | Poor 2.2% |
| Immigrants | Uruguay | 11.5 /100 | #210 | Poor 2.2% |
| Indonesians | 9.5 /100 | #211 | Tragic 2.2% |
| Bermudans | 9.0 /100 | #212 | Tragic 2.2% |
| Immigrants | Ghana | 8.9 /100 | #213 | Tragic 2.2% |
| Trinidadians and Tobagonians | 8.2 /100 | #214 | Tragic 2.2% |