Maltese vs Immigrants from Nigeria Seniors Poverty Over the Age of 65
COMPARE
Maltese
Immigrants from Nigeria
Seniors Poverty Over the Age of 65
Seniors Poverty Over the Age of 65 Comparison
Maltese
Immigrants from Nigeria
9.1%
SENIORS POVERTY OVER THE AGE OF 65
99.9/ 100
METRIC RATING
11th/ 347
METRIC RANK
11.7%
SENIORS POVERTY OVER THE AGE OF 65
3.4/ 100
METRIC RATING
224th/ 347
METRIC RANK
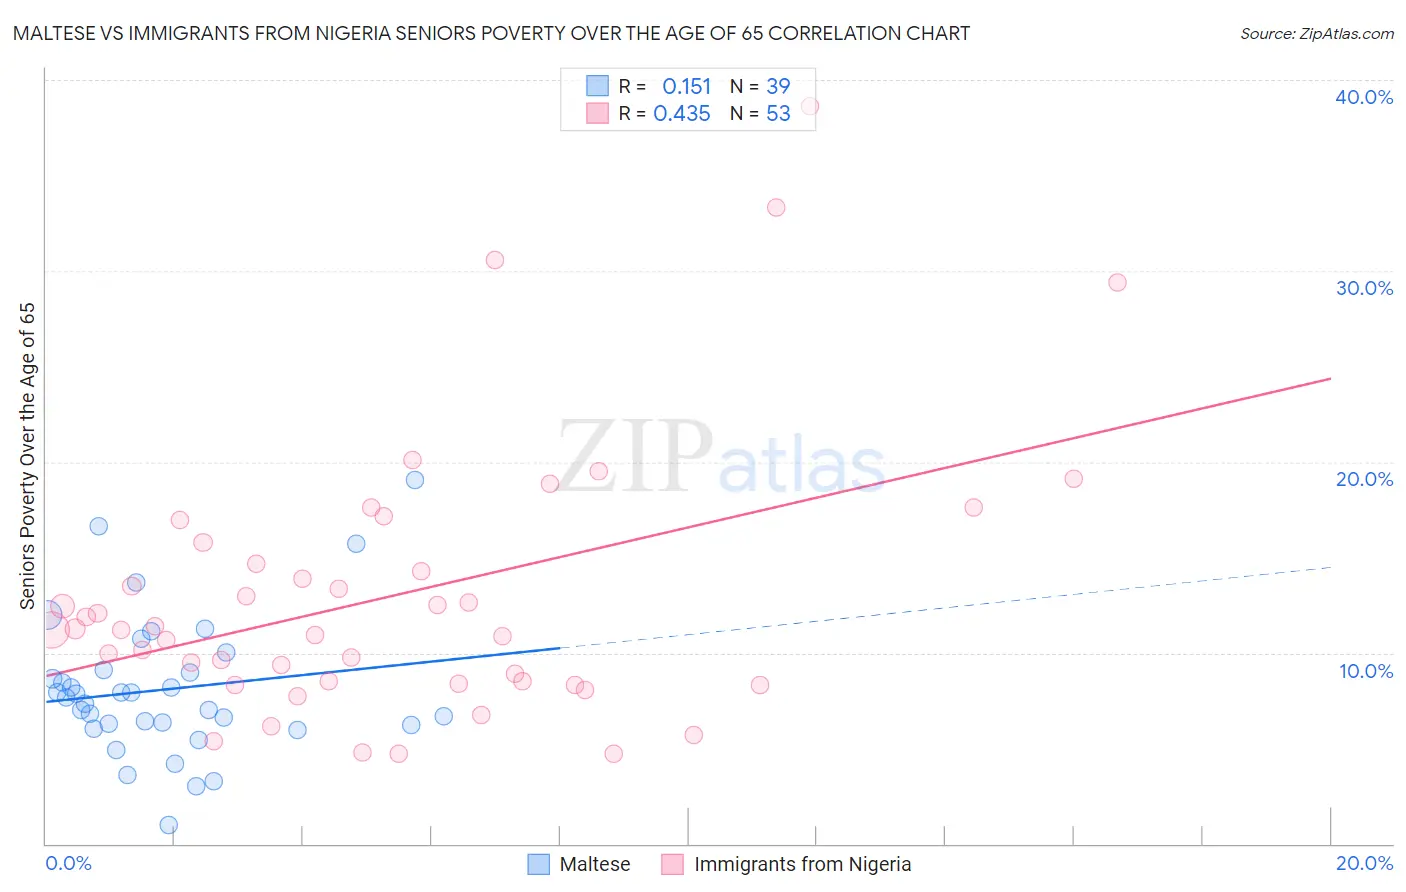
Maltese vs Immigrants from Nigeria Seniors Poverty Over the Age of 65 Correlation Chart
The statistical analysis conducted on geographies consisting of 126,339,773 people shows a poor positive correlation between the proportion of Maltese and poverty level among seniors over the age of 65 in the United States with a correlation coefficient (R) of 0.151 and weighted average of 9.1%. Similarly, the statistical analysis conducted on geographies consisting of 282,843,224 people shows a moderate positive correlation between the proportion of Immigrants from Nigeria and poverty level among seniors over the age of 65 in the United States with a correlation coefficient (R) of 0.435 and weighted average of 11.7%, a difference of 29.0%.
Seniors Poverty Over the Age of 65 Correlation Summary
| Measurement | Maltese | Immigrants from Nigeria |
| Minimum | 1.00% | 4.7% |
| Maximum | 19.0% | 38.6% |
| Range | 18.0% | 33.9% |
| Mean | 8.1% | 13.0% |
| Median | 7.7% | 11.2% |
| Interquartile 25% (IQ1) | 6.2% | 8.4% |
| Interquartile 75% (IQ3) | 9.1% | 15.2% |
| Interquartile Range (IQR) | 2.9% | 6.8% |
| Standard Deviation (Sample) | 3.7% | 7.1% |
| Standard Deviation (Population) | 3.6% | 7.0% |
Similar Demographics by Seniors Poverty Over the Age of 65
Demographics Similar to Maltese by Seniors Poverty Over the Age of 65
In terms of seniors poverty over the age of 65, the demographic groups most similar to Maltese are Scandinavian (9.1%, a difference of 0.18%), Croatian (9.1%, a difference of 0.22%), Polish (9.1%, a difference of 0.26%), Dutch (9.1%, a difference of 0.32%), and Lithuanian (9.1%, a difference of 0.43%).
| Demographics | Rating | Rank | Seniors Poverty Over the Age of 65 |
| Swedes | 100.0 /100 | #4 | Exceptional 8.7% |
| Immigrants | India | 100.0 /100 | #5 | Exceptional 8.8% |
| Danes | 100.0 /100 | #6 | Exceptional 8.8% |
| Germans | 100.0 /100 | #7 | Exceptional 9.0% |
| Czechs | 100.0 /100 | #8 | Exceptional 9.0% |
| English | 100.0 /100 | #9 | Exceptional 9.1% |
| Lithuanians | 100.0 /100 | #10 | Exceptional 9.1% |
| Maltese | 99.9 /100 | #11 | Exceptional 9.1% |
| Scandinavians | 99.9 /100 | #12 | Exceptional 9.1% |
| Croatians | 99.9 /100 | #13 | Exceptional 9.1% |
| Poles | 99.9 /100 | #14 | Exceptional 9.1% |
| Dutch | 99.9 /100 | #15 | Exceptional 9.1% |
| Europeans | 99.9 /100 | #16 | Exceptional 9.2% |
| Scottish | 99.9 /100 | #17 | Exceptional 9.2% |
| Slovaks | 99.9 /100 | #18 | Exceptional 9.2% |
Demographics Similar to Immigrants from Nigeria by Seniors Poverty Over the Age of 65
In terms of seniors poverty over the age of 65, the demographic groups most similar to Immigrants from Nigeria are Immigrants from Belarus (11.8%, a difference of 0.10%), Liberian (11.8%, a difference of 0.12%), Nigerian (11.8%, a difference of 0.16%), Immigrants from Congo (11.7%, a difference of 0.24%), and Immigrants from Chile (11.7%, a difference of 0.28%).
| Demographics | Rating | Rank | Seniors Poverty Over the Age of 65 |
| Immigrants | Africa | 6.4 /100 | #217 | Tragic 11.6% |
| Immigrants | Ukraine | 5.7 /100 | #218 | Tragic 11.6% |
| Arapaho | 5.2 /100 | #219 | Tragic 11.6% |
| Peruvians | 4.2 /100 | #220 | Tragic 11.7% |
| Argentineans | 4.1 /100 | #221 | Tragic 11.7% |
| Immigrants | Chile | 3.9 /100 | #222 | Tragic 11.7% |
| Immigrants | Congo | 3.8 /100 | #223 | Tragic 11.7% |
| Immigrants | Nigeria | 3.4 /100 | #224 | Tragic 11.7% |
| Immigrants | Belarus | 3.2 /100 | #225 | Tragic 11.8% |
| Liberians | 3.2 /100 | #226 | Tragic 11.8% |
| Nigerians | 3.2 /100 | #227 | Tragic 11.8% |
| Immigrants | Costa Rica | 2.7 /100 | #228 | Tragic 11.8% |
| Immigrants | Eritrea | 2.6 /100 | #229 | Tragic 11.8% |
| Bermudans | 2.1 /100 | #230 | Tragic 11.9% |
| Cajuns | 2.0 /100 | #231 | Tragic 11.9% |