Maltese vs Guamanian/Chamorro Vision Disability
COMPARE
Maltese
Guamanian/Chamorro
Vision Disability
Vision Disability Comparison
Maltese
Guamanians/Chamorros
2.0%
VISION DISABILITY
98.9/ 100
METRIC RATING
65th/ 347
METRIC RANK
2.3%
VISION DISABILITY
3.9/ 100
METRIC RATING
220th/ 347
METRIC RANK
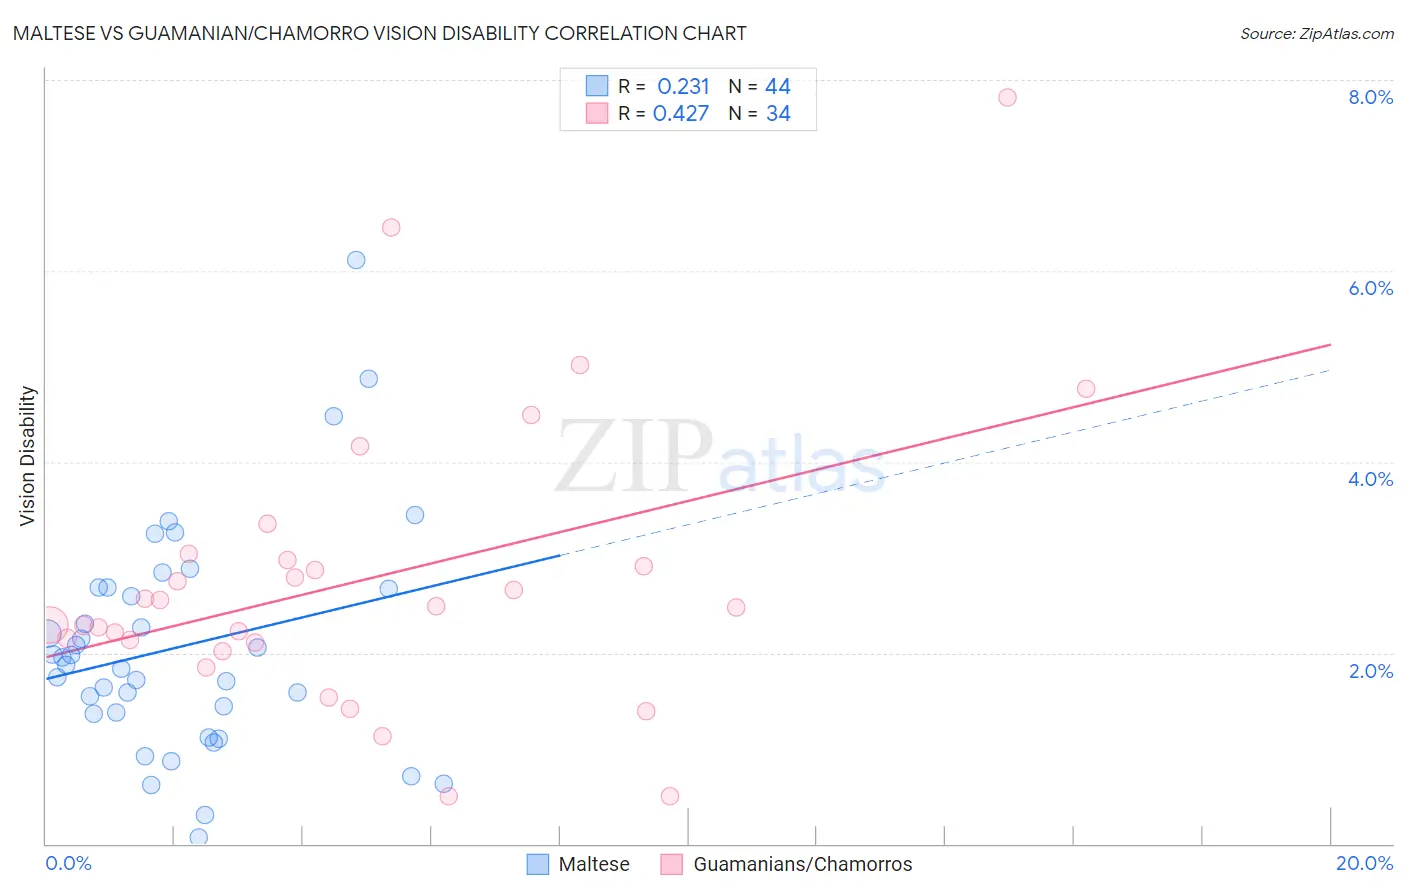
Maltese vs Guamanian/Chamorro Vision Disability Correlation Chart
The statistical analysis conducted on geographies consisting of 126,445,167 people shows a weak positive correlation between the proportion of Maltese and percentage of population with vision disability in the United States with a correlation coefficient (R) of 0.231 and weighted average of 2.0%. Similarly, the statistical analysis conducted on geographies consisting of 221,799,275 people shows a moderate positive correlation between the proportion of Guamanians/Chamorros and percentage of population with vision disability in the United States with a correlation coefficient (R) of 0.427 and weighted average of 2.3%, a difference of 13.1%.
Vision Disability Correlation Summary
| Measurement | Maltese | Guamanian/Chamorro |
| Minimum | 0.070% | 0.50% |
| Maximum | 6.1% | 7.8% |
| Range | 6.0% | 7.3% |
| Mean | 2.1% | 2.8% |
| Median | 1.9% | 2.5% |
| Interquartile 25% (IQ1) | 1.4% | 2.1% |
| Interquartile 75% (IQ3) | 2.7% | 3.0% |
| Interquartile Range (IQR) | 1.3% | 0.87% |
| Standard Deviation (Sample) | 1.2% | 1.5% |
| Standard Deviation (Population) | 1.2% | 1.5% |
Similar Demographics by Vision Disability
Demographics Similar to Maltese by Vision Disability
In terms of vision disability, the demographic groups most similar to Maltese are Immigrants from Argentina (2.0%, a difference of 0.060%), Immigrants from Greece (2.0%, a difference of 0.070%), Immigrants from Northern Africa (2.0%, a difference of 0.17%), Armenian (2.0%, a difference of 0.20%), and Immigrants from Czechoslovakia (2.0%, a difference of 0.27%).
| Demographics | Rating | Rank | Vision Disability |
| Immigrants | Saudi Arabia | 99.2 /100 | #58 | Exceptional 2.0% |
| Argentineans | 99.1 /100 | #59 | Exceptional 2.0% |
| Immigrants | Romania | 99.1 /100 | #60 | Exceptional 2.0% |
| Immigrants | Belgium | 99.1 /100 | #61 | Exceptional 2.0% |
| Immigrants | Russia | 99.1 /100 | #62 | Exceptional 2.0% |
| Armenians | 99.0 /100 | #63 | Exceptional 2.0% |
| Immigrants | Greece | 99.0 /100 | #64 | Exceptional 2.0% |
| Maltese | 98.9 /100 | #65 | Exceptional 2.0% |
| Immigrants | Argentina | 98.9 /100 | #66 | Exceptional 2.0% |
| Immigrants | Northern Africa | 98.8 /100 | #67 | Exceptional 2.0% |
| Immigrants | Czechoslovakia | 98.7 /100 | #68 | Exceptional 2.0% |
| Russians | 98.6 /100 | #69 | Exceptional 2.0% |
| Immigrants | Kazakhstan | 98.6 /100 | #70 | Exceptional 2.0% |
| Immigrants | Northern Europe | 98.6 /100 | #71 | Exceptional 2.0% |
| Immigrants | France | 98.5 /100 | #72 | Exceptional 2.0% |
Demographics Similar to Guamanians/Chamorros by Vision Disability
In terms of vision disability, the demographic groups most similar to Guamanians/Chamorros are French Canadian (2.3%, a difference of 0.020%), Immigrants from Senegal (2.3%, a difference of 0.040%), Basque (2.3%, a difference of 0.18%), Irish (2.3%, a difference of 0.20%), and Immigrants from Western Africa (2.3%, a difference of 0.22%).
| Demographics | Rating | Rank | Vision Disability |
| Immigrants | Ghana | 8.9 /100 | #213 | Tragic 2.2% |
| Trinidadians and Tobagonians | 8.2 /100 | #214 | Tragic 2.2% |
| Nigerians | 7.2 /100 | #215 | Tragic 2.3% |
| Immigrants | Trinidad and Tobago | 6.1 /100 | #216 | Tragic 2.3% |
| Barbadians | 5.1 /100 | #217 | Tragic 2.3% |
| Portuguese | 4.9 /100 | #218 | Tragic 2.3% |
| Ecuadorians | 4.6 /100 | #219 | Tragic 2.3% |
| Guamanians/Chamorros | 3.9 /100 | #220 | Tragic 2.3% |
| French Canadians | 3.9 /100 | #221 | Tragic 2.3% |
| Immigrants | Senegal | 3.8 /100 | #222 | Tragic 2.3% |
| Basques | 3.5 /100 | #223 | Tragic 2.3% |
| Irish | 3.4 /100 | #224 | Tragic 2.3% |
| Immigrants | Western Africa | 3.4 /100 | #225 | Tragic 2.3% |
| Immigrants | Germany | 3.0 /100 | #226 | Tragic 2.3% |
| Hawaiians | 2.9 /100 | #227 | Tragic 2.3% |