Yaqui vs Immigrants from Nigeria Vision Disability
COMPARE
Yaqui
Immigrants from Nigeria
Vision Disability
Vision Disability Comparison
Yaqui
Immigrants from Nigeria
2.5%
VISION DISABILITY
0.0/ 100
METRIC RATING
293rd/ 347
METRIC RANK
2.2%
VISION DISABILITY
13.5/ 100
METRIC RATING
207th/ 347
METRIC RANK
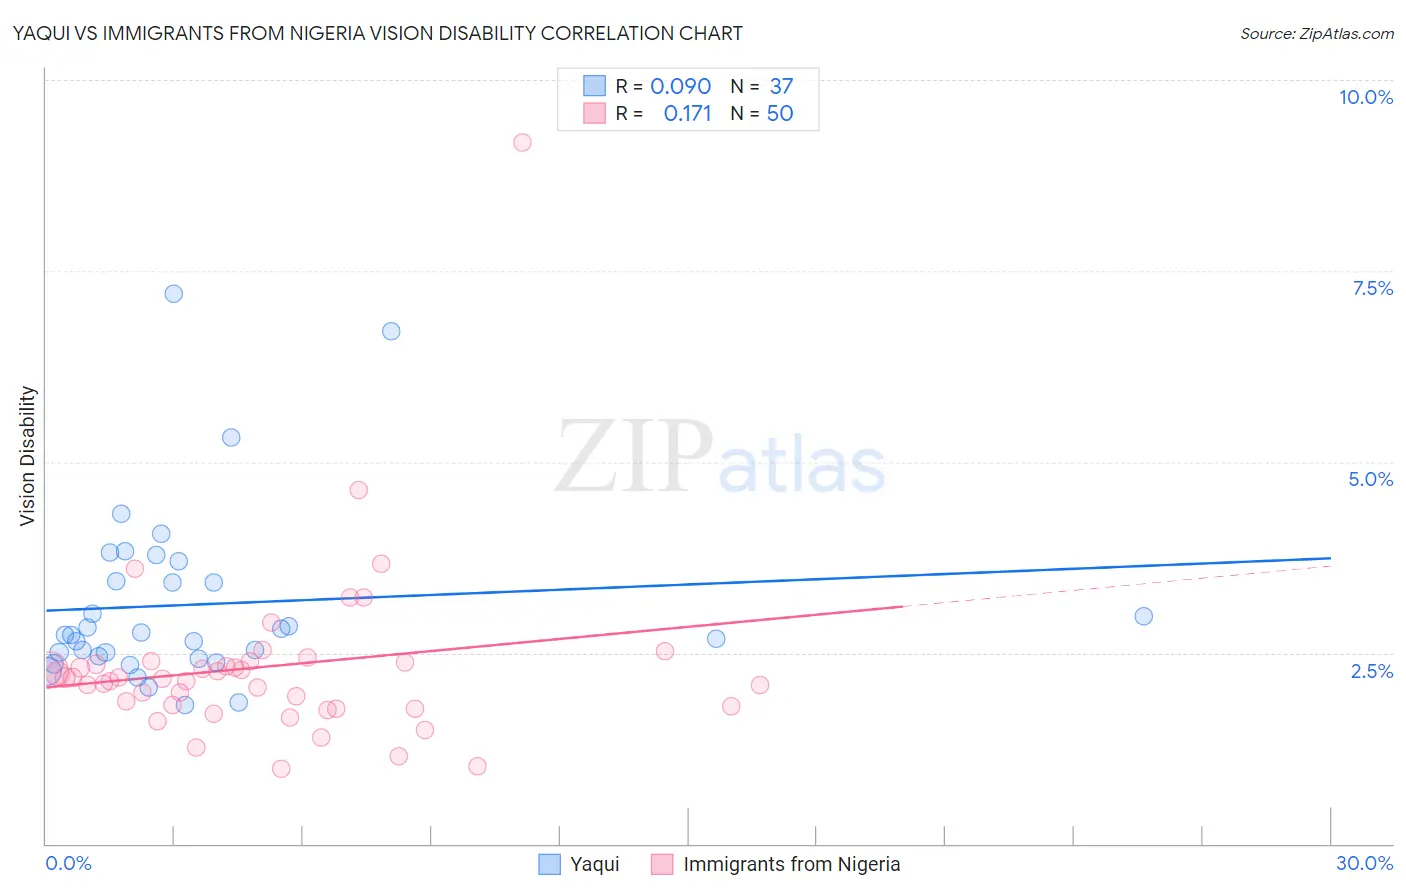
Yaqui vs Immigrants from Nigeria Vision Disability Correlation Chart
The statistical analysis conducted on geographies consisting of 107,692,151 people shows a slight positive correlation between the proportion of Yaqui and percentage of population with vision disability in the United States with a correlation coefficient (R) of 0.090 and weighted average of 2.5%. Similarly, the statistical analysis conducted on geographies consisting of 283,383,362 people shows a poor positive correlation between the proportion of Immigrants from Nigeria and percentage of population with vision disability in the United States with a correlation coefficient (R) of 0.171 and weighted average of 2.2%, a difference of 11.9%.
Vision Disability Correlation Summary
| Measurement | Yaqui | Immigrants from Nigeria |
| Minimum | 1.8% | 0.98% |
| Maximum | 7.2% | 9.2% |
| Range | 5.4% | 8.2% |
| Mean | 3.1% | 2.3% |
| Median | 2.7% | 2.2% |
| Interquartile 25% (IQ1) | 2.4% | 1.8% |
| Interquartile 75% (IQ3) | 3.6% | 2.4% |
| Interquartile Range (IQR) | 1.1% | 0.58% |
| Standard Deviation (Sample) | 1.2% | 1.2% |
| Standard Deviation (Population) | 1.2% | 1.2% |
Similar Demographics by Vision Disability
Demographics Similar to Yaqui by Vision Disability
In terms of vision disability, the demographic groups most similar to Yaqui are Crow (2.5%, a difference of 0.030%), Immigrants from Honduras (2.5%, a difference of 0.12%), Ottawa (2.5%, a difference of 0.34%), Immigrants from Cuba (2.5%, a difference of 0.52%), and Delaware (2.5%, a difference of 0.55%).
| Demographics | Rating | Rank | Vision Disability |
| Sioux | 0.0 /100 | #286 | Tragic 2.5% |
| Hondurans | 0.0 /100 | #287 | Tragic 2.5% |
| French American Indians | 0.0 /100 | #288 | Tragic 2.5% |
| Immigrants | Nonimmigrants | 0.0 /100 | #289 | Tragic 2.5% |
| Immigrants | Cuba | 0.0 /100 | #290 | Tragic 2.5% |
| Immigrants | Honduras | 0.0 /100 | #291 | Tragic 2.5% |
| Crow | 0.0 /100 | #292 | Tragic 2.5% |
| Yaqui | 0.0 /100 | #293 | Tragic 2.5% |
| Ottawa | 0.0 /100 | #294 | Tragic 2.5% |
| Delaware | 0.0 /100 | #295 | Tragic 2.5% |
| Immigrants | Mexico | 0.0 /100 | #296 | Tragic 2.5% |
| Immigrants | Dominica | 0.0 /100 | #297 | Tragic 2.5% |
| Mexicans | 0.0 /100 | #298 | Tragic 2.5% |
| Cree | 0.0 /100 | #299 | Tragic 2.5% |
| Africans | 0.0 /100 | #300 | Tragic 2.5% |
Demographics Similar to Immigrants from Nigeria by Vision Disability
In terms of vision disability, the demographic groups most similar to Immigrants from Nigeria are German (2.2%, a difference of 0.010%), Immigrants from Brazil (2.2%, a difference of 0.040%), Pennsylvania German (2.2%, a difference of 0.13%), Samoan (2.2%, a difference of 0.27%), and Immigrants from Uruguay (2.2%, a difference of 0.27%).
| Demographics | Rating | Rank | Vision Disability |
| Immigrants | Thailand | 20.1 /100 | #200 | Fair 2.2% |
| Slovaks | 18.8 /100 | #201 | Poor 2.2% |
| Immigrants | Zaire | 18.0 /100 | #202 | Poor 2.2% |
| Dutch | 17.1 /100 | #203 | Poor 2.2% |
| Immigrants | Guyana | 15.9 /100 | #204 | Poor 2.2% |
| Samoans | 15.7 /100 | #205 | Poor 2.2% |
| Pennsylvania Germans | 14.5 /100 | #206 | Poor 2.2% |
| Immigrants | Nigeria | 13.5 /100 | #207 | Poor 2.2% |
| Germans | 13.4 /100 | #208 | Poor 2.2% |
| Immigrants | Brazil | 13.1 /100 | #209 | Poor 2.2% |
| Immigrants | Uruguay | 11.5 /100 | #210 | Poor 2.2% |
| Indonesians | 9.5 /100 | #211 | Tragic 2.2% |
| Bermudans | 9.0 /100 | #212 | Tragic 2.2% |
| Immigrants | Ghana | 8.9 /100 | #213 | Tragic 2.2% |
| Trinidadians and Tobagonians | 8.2 /100 | #214 | Tragic 2.2% |