Maltese vs Mexican Vision Disability
COMPARE
Maltese
Mexican
Vision Disability
Vision Disability Comparison
Maltese
Mexicans
2.0%
VISION DISABILITY
98.9/ 100
METRIC RATING
65th/ 347
METRIC RANK
2.5%
VISION DISABILITY
0.0/ 100
METRIC RATING
298th/ 347
METRIC RANK
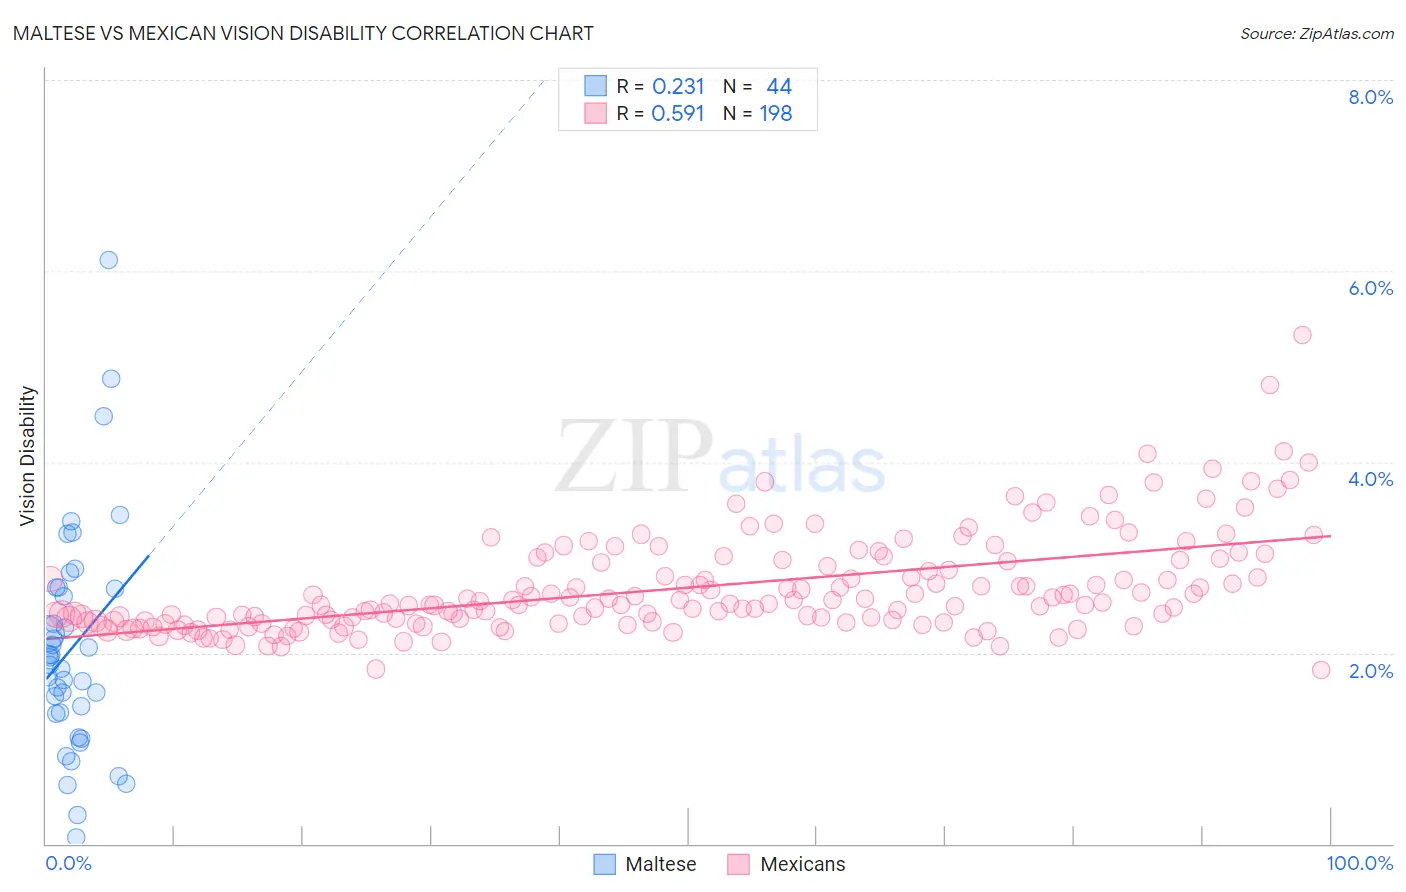
Maltese vs Mexican Vision Disability Correlation Chart
The statistical analysis conducted on geographies consisting of 126,445,167 people shows a weak positive correlation between the proportion of Maltese and percentage of population with vision disability in the United States with a correlation coefficient (R) of 0.231 and weighted average of 2.0%. Similarly, the statistical analysis conducted on geographies consisting of 563,538,234 people shows a substantial positive correlation between the proportion of Mexicans and percentage of population with vision disability in the United States with a correlation coefficient (R) of 0.591 and weighted average of 2.5%, a difference of 25.9%.
Vision Disability Correlation Summary
| Measurement | Maltese | Mexican |
| Minimum | 0.070% | 1.8% |
| Maximum | 6.1% | 5.3% |
| Range | 6.0% | 3.5% |
| Mean | 2.1% | 2.7% |
| Median | 1.9% | 2.5% |
| Interquartile 25% (IQ1) | 1.4% | 2.3% |
| Interquartile 75% (IQ3) | 2.7% | 2.9% |
| Interquartile Range (IQR) | 1.3% | 0.62% |
| Standard Deviation (Sample) | 1.2% | 0.52% |
| Standard Deviation (Population) | 1.2% | 0.52% |
Similar Demographics by Vision Disability
Demographics Similar to Maltese by Vision Disability
In terms of vision disability, the demographic groups most similar to Maltese are Immigrants from Argentina (2.0%, a difference of 0.060%), Immigrants from Greece (2.0%, a difference of 0.070%), Immigrants from Northern Africa (2.0%, a difference of 0.17%), Armenian (2.0%, a difference of 0.20%), and Immigrants from Czechoslovakia (2.0%, a difference of 0.27%).
| Demographics | Rating | Rank | Vision Disability |
| Immigrants | Saudi Arabia | 99.2 /100 | #58 | Exceptional 2.0% |
| Argentineans | 99.1 /100 | #59 | Exceptional 2.0% |
| Immigrants | Romania | 99.1 /100 | #60 | Exceptional 2.0% |
| Immigrants | Belgium | 99.1 /100 | #61 | Exceptional 2.0% |
| Immigrants | Russia | 99.1 /100 | #62 | Exceptional 2.0% |
| Armenians | 99.0 /100 | #63 | Exceptional 2.0% |
| Immigrants | Greece | 99.0 /100 | #64 | Exceptional 2.0% |
| Maltese | 98.9 /100 | #65 | Exceptional 2.0% |
| Immigrants | Argentina | 98.9 /100 | #66 | Exceptional 2.0% |
| Immigrants | Northern Africa | 98.8 /100 | #67 | Exceptional 2.0% |
| Immigrants | Czechoslovakia | 98.7 /100 | #68 | Exceptional 2.0% |
| Russians | 98.6 /100 | #69 | Exceptional 2.0% |
| Immigrants | Kazakhstan | 98.6 /100 | #70 | Exceptional 2.0% |
| Immigrants | Northern Europe | 98.6 /100 | #71 | Exceptional 2.0% |
| Immigrants | France | 98.5 /100 | #72 | Exceptional 2.0% |
Demographics Similar to Mexicans by Vision Disability
In terms of vision disability, the demographic groups most similar to Mexicans are Cree (2.5%, a difference of 0.040%), Immigrants from Dominica (2.5%, a difference of 0.14%), African (2.5%, a difference of 0.24%), Menominee (2.5%, a difference of 0.41%), and Immigrants from Mexico (2.5%, a difference of 0.82%).
| Demographics | Rating | Rank | Vision Disability |
| Immigrants | Honduras | 0.0 /100 | #291 | Tragic 2.5% |
| Crow | 0.0 /100 | #292 | Tragic 2.5% |
| Yaqui | 0.0 /100 | #293 | Tragic 2.5% |
| Ottawa | 0.0 /100 | #294 | Tragic 2.5% |
| Delaware | 0.0 /100 | #295 | Tragic 2.5% |
| Immigrants | Mexico | 0.0 /100 | #296 | Tragic 2.5% |
| Immigrants | Dominica | 0.0 /100 | #297 | Tragic 2.5% |
| Mexicans | 0.0 /100 | #298 | Tragic 2.5% |
| Cree | 0.0 /100 | #299 | Tragic 2.5% |
| Africans | 0.0 /100 | #300 | Tragic 2.5% |
| Menominee | 0.0 /100 | #301 | Tragic 2.5% |
| Spanish American Indians | 0.0 /100 | #302 | Tragic 2.6% |
| Immigrants | Cabo Verde | 0.0 /100 | #303 | Tragic 2.6% |
| Aleuts | 0.0 /100 | #304 | Tragic 2.6% |
| Hispanics or Latinos | 0.0 /100 | #305 | Tragic 2.6% |