Immigrants from Burma/Myanmar vs Immigrants from Italy Disability Age Under 5
COMPARE
Immigrants from Burma/Myanmar
Immigrants from Italy
Disability Age Under 5
Disability Age Under 5 Comparison
Immigrants from Burma/Myanmar
Immigrants from Italy
1.1%
DISABILITY AGE UNDER 5
98.2/ 100
METRIC RATING
76th/ 347
METRIC RANK
1.3%
DISABILITY AGE UNDER 5
25.4/ 100
METRIC RATING
201st/ 347
METRIC RANK
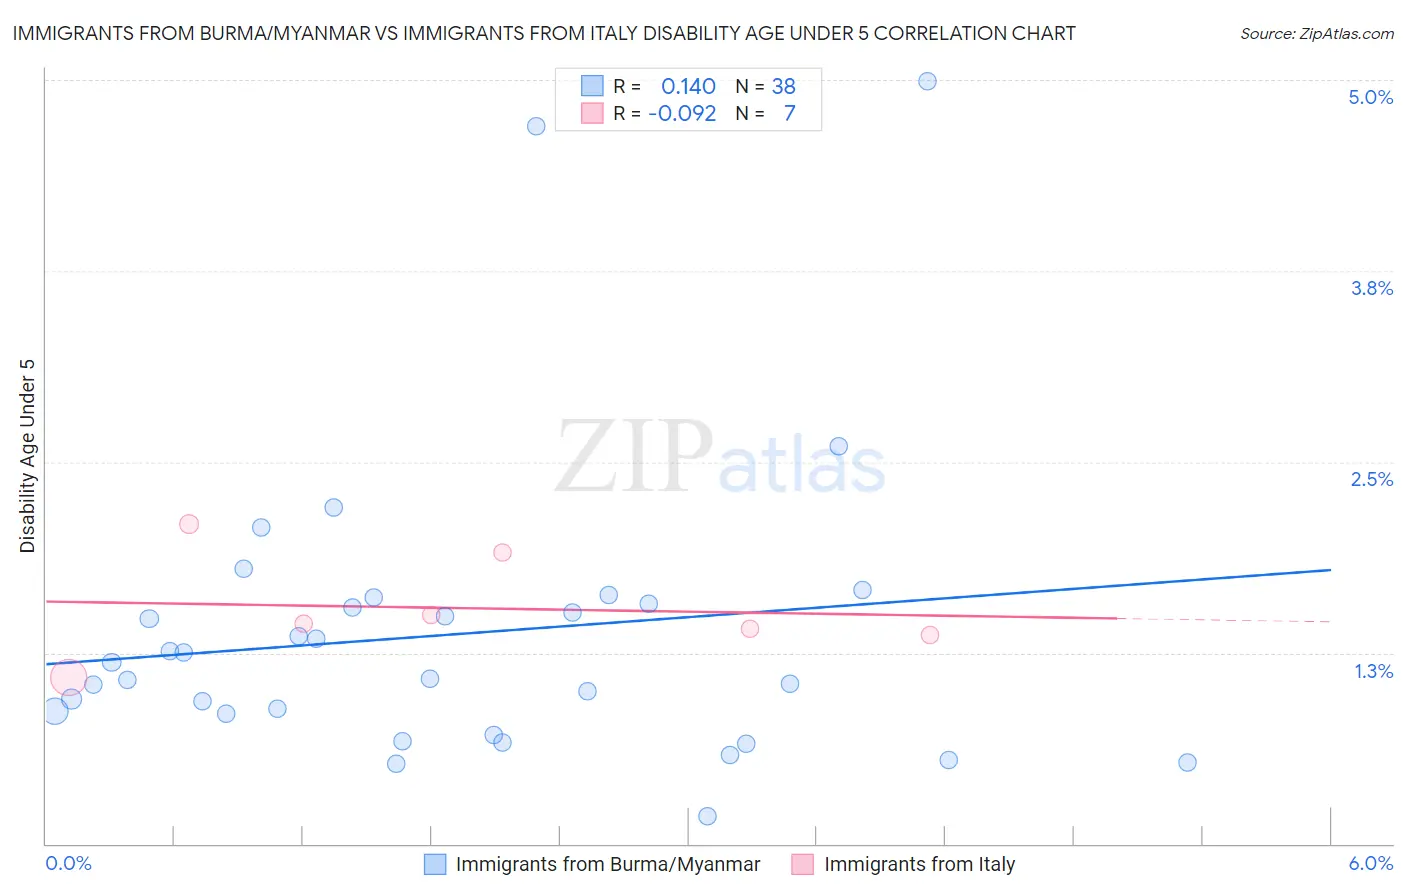
Immigrants from Burma/Myanmar vs Immigrants from Italy Disability Age Under 5 Correlation Chart
The statistical analysis conducted on geographies consisting of 121,763,943 people shows a poor positive correlation between the proportion of Immigrants from Burma/Myanmar and percentage of population with a disability under the age of 5 in the United States with a correlation coefficient (R) of 0.140 and weighted average of 1.1%. Similarly, the statistical analysis conducted on geographies consisting of 181,565,904 people shows a slight negative correlation between the proportion of Immigrants from Italy and percentage of population with a disability under the age of 5 in the United States with a correlation coefficient (R) of -0.092 and weighted average of 1.3%, a difference of 12.7%.
Disability Age Under 5 Correlation Summary
| Measurement | Immigrants from Burma/Myanmar | Immigrants from Italy |
| Minimum | 0.18% | 1.1% |
| Maximum | 5.0% | 2.1% |
| Range | 4.8% | 1.0% |
| Mean | 1.4% | 1.5% |
| Median | 1.1% | 1.4% |
| Interquartile 25% (IQ1) | 0.85% | 1.4% |
| Interquartile 75% (IQ3) | 1.6% | 1.9% |
| Interquartile Range (IQR) | 0.72% | 0.54% |
| Standard Deviation (Sample) | 0.98% | 0.34% |
| Standard Deviation (Population) | 0.96% | 0.32% |
Similar Demographics by Disability Age Under 5
Demographics Similar to Immigrants from Burma/Myanmar by Disability Age Under 5
In terms of disability age under 5, the demographic groups most similar to Immigrants from Burma/Myanmar are Immigrants from Denmark (1.1%, a difference of 0.14%), Immigrants from Pakistan (1.1%, a difference of 0.26%), West Indian (1.1%, a difference of 0.26%), Hmong (1.1%, a difference of 0.28%), and Immigrants from Trinidad and Tobago (1.1%, a difference of 0.31%).
| Demographics | Rating | Rank | Disability Age Under 5 |
| Israelis | 98.7 /100 | #69 | Exceptional 1.1% |
| Immigrants | Ecuador | 98.6 /100 | #70 | Exceptional 1.1% |
| Trinidadians and Tobagonians | 98.6 /100 | #71 | Exceptional 1.1% |
| Burmese | 98.5 /100 | #72 | Exceptional 1.1% |
| Immigrants | Sri Lanka | 98.5 /100 | #73 | Exceptional 1.1% |
| Jordanians | 98.5 /100 | #74 | Exceptional 1.1% |
| Immigrants | Pakistan | 98.4 /100 | #75 | Exceptional 1.1% |
| Immigrants | Burma/Myanmar | 98.2 /100 | #76 | Exceptional 1.1% |
| Immigrants | Denmark | 98.1 /100 | #77 | Exceptional 1.1% |
| West Indians | 98.0 /100 | #78 | Exceptional 1.1% |
| Hmong | 98.0 /100 | #79 | Exceptional 1.1% |
| Immigrants | Trinidad and Tobago | 98.0 /100 | #80 | Exceptional 1.1% |
| Turks | 98.0 /100 | #81 | Exceptional 1.1% |
| Immigrants | Jordan | 97.9 /100 | #82 | Exceptional 1.1% |
| Immigrants | Syria | 97.9 /100 | #83 | Exceptional 1.1% |
Demographics Similar to Immigrants from Italy by Disability Age Under 5
In terms of disability age under 5, the demographic groups most similar to Immigrants from Italy are Arapaho (1.3%, a difference of 0.15%), Liberian (1.3%, a difference of 0.16%), Immigrants from Lithuania (1.3%, a difference of 0.20%), Immigrants from Europe (1.3%, a difference of 0.21%), and Romanian (1.3%, a difference of 0.34%).
| Demographics | Rating | Rank | Disability Age Under 5 |
| Immigrants | North Macedonia | 34.7 /100 | #194 | Fair 1.3% |
| U.S. Virgin Islanders | 34.4 /100 | #195 | Fair 1.3% |
| Immigrants | Belgium | 31.4 /100 | #196 | Fair 1.3% |
| Immigrants | Somalia | 31.3 /100 | #197 | Fair 1.3% |
| Immigrants | Norway | 31.1 /100 | #198 | Fair 1.3% |
| Jamaicans | 30.7 /100 | #199 | Fair 1.3% |
| Immigrants | Lithuania | 27.2 /100 | #200 | Fair 1.3% |
| Immigrants | Italy | 25.4 /100 | #201 | Fair 1.3% |
| Arapaho | 24.1 /100 | #202 | Fair 1.3% |
| Liberians | 24.0 /100 | #203 | Fair 1.3% |
| Immigrants | Europe | 23.6 /100 | #204 | Fair 1.3% |
| Romanians | 22.5 /100 | #205 | Fair 1.3% |
| Immigrants | Poland | 22.4 /100 | #206 | Fair 1.3% |
| Nigerians | 21.2 /100 | #207 | Fair 1.3% |
| Mexicans | 20.8 /100 | #208 | Fair 1.3% |