Maltese vs Immigrants from Italy In Labor Force | Age 20-24
COMPARE
Maltese
Immigrants from Italy
In Labor Force | Age 20-24
In Labor Force | Age 20-24 Comparison
Maltese
Immigrants from Italy
76.3%
IN LABOR FORCE | AGE 20-24
98.9/ 100
METRIC RATING
92nd/ 347
METRIC RANK
74.6%
IN LABOR FORCE | AGE 20-24
17.6/ 100
METRIC RATING
204th/ 347
METRIC RANK
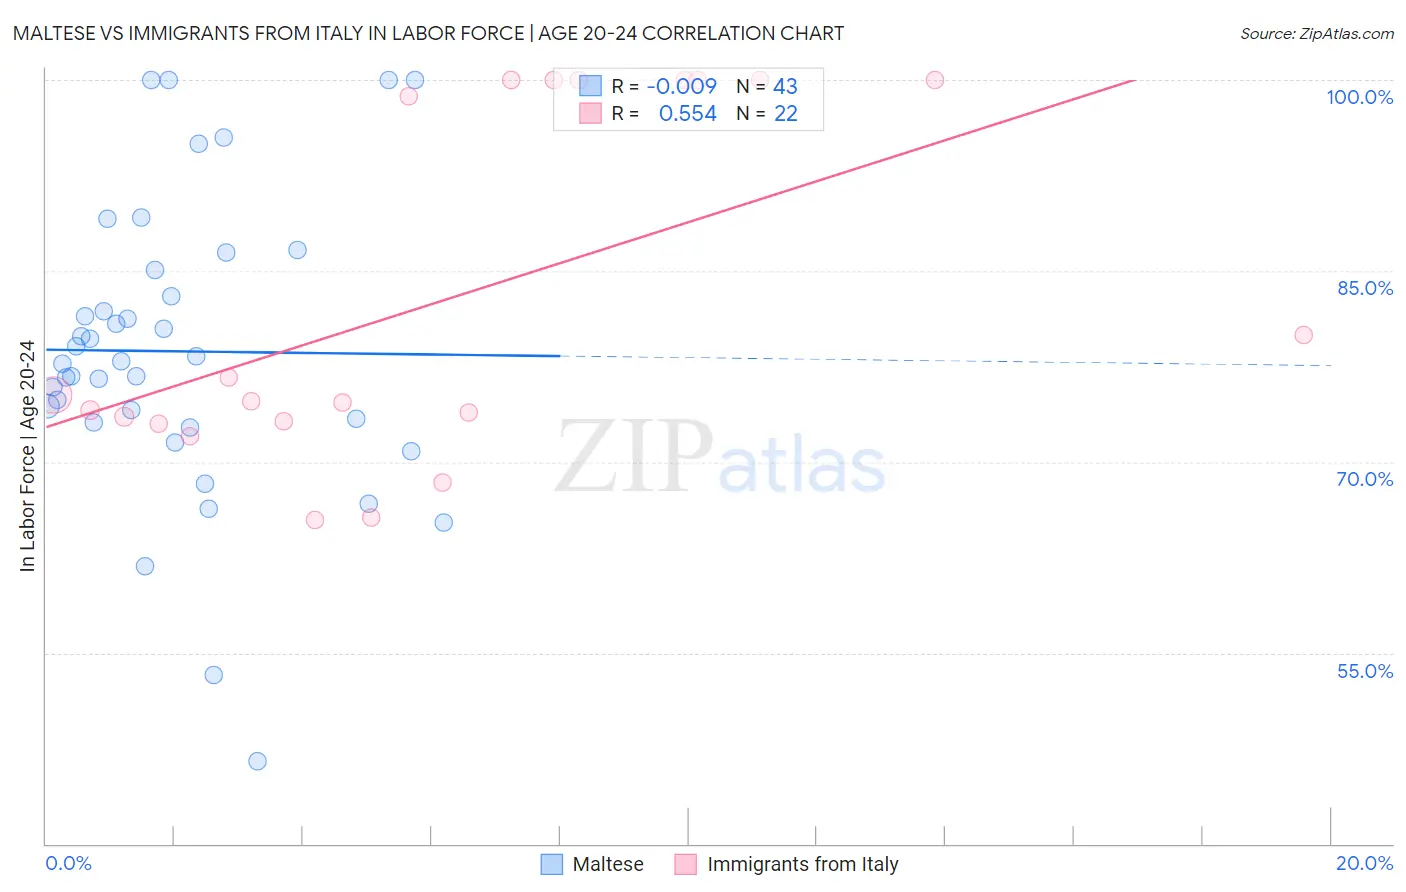
Maltese vs Immigrants from Italy In Labor Force | Age 20-24 Correlation Chart
The statistical analysis conducted on geographies consisting of 126,433,922 people shows no correlation between the proportion of Maltese and labor force participation rate among population between the ages 20 and 24 in the United States with a correlation coefficient (R) of -0.009 and weighted average of 76.3%. Similarly, the statistical analysis conducted on geographies consisting of 324,060,092 people shows a substantial positive correlation between the proportion of Immigrants from Italy and labor force participation rate among population between the ages 20 and 24 in the United States with a correlation coefficient (R) of 0.554 and weighted average of 74.6%, a difference of 2.2%.
In Labor Force | Age 20-24 Correlation Summary
| Measurement | Maltese | Immigrants from Italy |
| Minimum | 46.5% | 65.4% |
| Maximum | 100.0% | 100.0% |
| Range | 53.5% | 34.6% |
| Mean | 78.7% | 82.7% |
| Median | 77.9% | 75.0% |
| Interquartile 25% (IQ1) | 73.1% | 73.2% |
| Interquartile 75% (IQ3) | 85.1% | 100.0% |
| Interquartile Range (IQR) | 12.0% | 26.8% |
| Standard Deviation (Sample) | 11.6% | 13.6% |
| Standard Deviation (Population) | 11.5% | 13.3% |
Similar Demographics by In Labor Force | Age 20-24
Demographics Similar to Maltese by In Labor Force | Age 20-24
In terms of in labor force | age 20-24, the demographic groups most similar to Maltese are Hungarian (76.3%, a difference of 0.020%), Sierra Leonean (76.3%, a difference of 0.030%), Immigrants from Burma/Myanmar (76.3%, a difference of 0.050%), Spanish (76.4%, a difference of 0.10%), and Bulgarian (76.4%, a difference of 0.10%).
| Demographics | Rating | Rank | In Labor Force | Age 20-24 |
| Portuguese | 99.3 /100 | #85 | Exceptional 76.4% |
| Immigrants | Iraq | 99.3 /100 | #86 | Exceptional 76.4% |
| Immigrants | Thailand | 99.3 /100 | #87 | Exceptional 76.4% |
| Spanish | 99.2 /100 | #88 | Exceptional 76.4% |
| Bulgarians | 99.2 /100 | #89 | Exceptional 76.4% |
| Immigrants | Burma/Myanmar | 99.1 /100 | #90 | Exceptional 76.3% |
| Sierra Leoneans | 99.0 /100 | #91 | Exceptional 76.3% |
| Maltese | 98.9 /100 | #92 | Exceptional 76.3% |
| Hungarians | 98.9 /100 | #93 | Exceptional 76.3% |
| Potawatomi | 98.5 /100 | #94 | Exceptional 76.2% |
| Immigrants | Germany | 98.5 /100 | #95 | Exceptional 76.2% |
| Immigrants | Nonimmigrants | 98.5 /100 | #96 | Exceptional 76.2% |
| Immigrants | Lithuania | 98.0 /100 | #97 | Exceptional 76.1% |
| Immigrants | Oceania | 98.0 /100 | #98 | Exceptional 76.1% |
| Americans | 97.8 /100 | #99 | Exceptional 76.1% |
Demographics Similar to Immigrants from Italy by In Labor Force | Age 20-24
In terms of in labor force | age 20-24, the demographic groups most similar to Immigrants from Italy are Inupiat (74.6%, a difference of 0.0%), Sioux (74.6%, a difference of 0.0%), Immigrants from Northern Africa (74.6%, a difference of 0.010%), Albanian (74.6%, a difference of 0.040%), and Immigrants from Uruguay (74.6%, a difference of 0.050%).
| Demographics | Rating | Rank | In Labor Force | Age 20-24 |
| Panamanians | 25.0 /100 | #197 | Fair 74.7% |
| Immigrants | Nigeria | 24.2 /100 | #198 | Fair 74.7% |
| Taiwanese | 23.2 /100 | #199 | Fair 74.7% |
| Nigerians | 21.9 /100 | #200 | Fair 74.7% |
| Choctaw | 21.4 /100 | #201 | Fair 74.7% |
| Moroccans | 20.4 /100 | #202 | Fair 74.7% |
| Immigrants | Northern Africa | 17.9 /100 | #203 | Poor 74.6% |
| Immigrants | Italy | 17.6 /100 | #204 | Poor 74.6% |
| Inupiat | 17.6 /100 | #205 | Poor 74.6% |
| Sioux | 17.5 /100 | #206 | Poor 74.6% |
| Albanians | 16.2 /100 | #207 | Poor 74.6% |
| Immigrants | Uruguay | 15.8 /100 | #208 | Poor 74.6% |
| Arabs | 15.8 /100 | #209 | Poor 74.6% |
| Uruguayans | 15.1 /100 | #210 | Poor 74.6% |
| Immigrants | Australia | 14.7 /100 | #211 | Poor 74.6% |