Malaysian vs Immigrants from Norway Female Disability
COMPARE
Malaysian
Immigrants from Norway
Female Disability
Female Disability Comparison
Malaysians
Immigrants from Norway
12.5%
FEMALE DISABILITY
5.0/ 100
METRIC RATING
235th/ 347
METRIC RANK
11.9%
FEMALE DISABILITY
93.8/ 100
METRIC RATING
137th/ 347
METRIC RANK
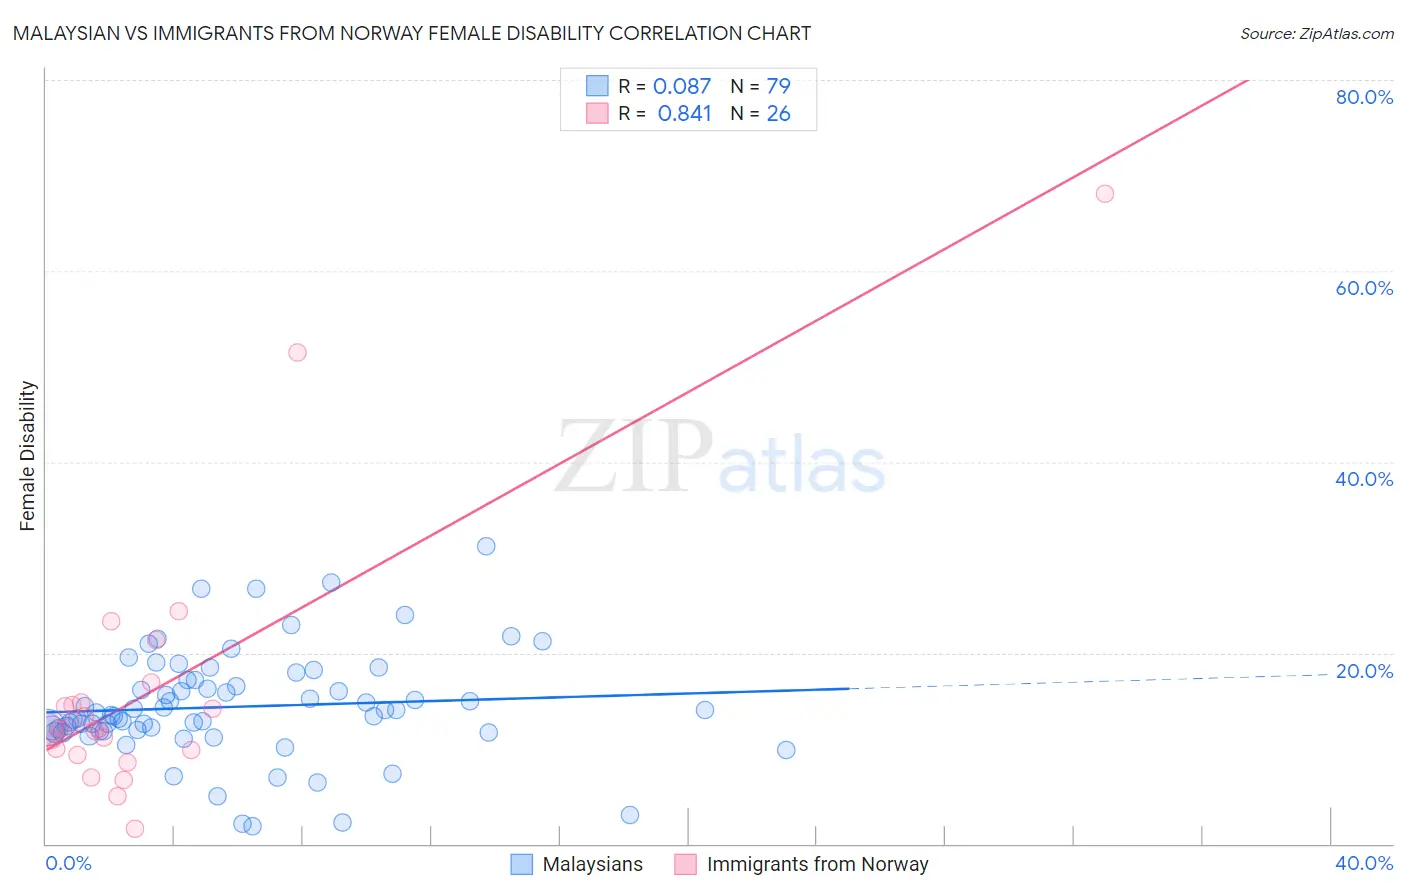
Malaysian vs Immigrants from Norway Female Disability Correlation Chart
The statistical analysis conducted on geographies consisting of 226,065,175 people shows a slight positive correlation between the proportion of Malaysians and percentage of females with a disability in the United States with a correlation coefficient (R) of 0.087 and weighted average of 12.5%. Similarly, the statistical analysis conducted on geographies consisting of 116,702,841 people shows a very strong positive correlation between the proportion of Immigrants from Norway and percentage of females with a disability in the United States with a correlation coefficient (R) of 0.841 and weighted average of 11.9%, a difference of 5.5%.
Female Disability Correlation Summary
| Measurement | Malaysian | Immigrants from Norway |
| Minimum | 1.8% | 1.5% |
| Maximum | 31.1% | 68.1% |
| Range | 29.3% | 66.6% |
| Mean | 14.3% | 16.0% |
| Median | 13.5% | 12.0% |
| Interquartile 25% (IQ1) | 11.8% | 9.8% |
| Interquartile 75% (IQ3) | 17.2% | 14.8% |
| Interquartile Range (IQR) | 5.4% | 5.0% |
| Standard Deviation (Sample) | 5.5% | 14.1% |
| Standard Deviation (Population) | 5.5% | 13.8% |
Similar Demographics by Female Disability
Demographics Similar to Malaysians by Female Disability
In terms of female disability, the demographic groups most similar to Malaysians are Scandinavian (12.5%, a difference of 0.050%), Immigrants from Iraq (12.5%, a difference of 0.060%), Immigrants from West Indies (12.6%, a difference of 0.13%), Immigrants from Somalia (12.5%, a difference of 0.17%), and Belgian (12.5%, a difference of 0.25%).
| Demographics | Rating | Rank | Female Disability |
| Immigrants | Cambodia | 7.8 /100 | #228 | Tragic 12.5% |
| Hungarians | 7.2 /100 | #229 | Tragic 12.5% |
| Immigrants | Belize | 7.0 /100 | #230 | Tragic 12.5% |
| Belgians | 6.5 /100 | #231 | Tragic 12.5% |
| Immigrants | Somalia | 5.9 /100 | #232 | Tragic 12.5% |
| Immigrants | Iraq | 5.3 /100 | #233 | Tragic 12.5% |
| Scandinavians | 5.3 /100 | #234 | Tragic 12.5% |
| Malaysians | 5.0 /100 | #235 | Tragic 12.5% |
| Immigrants | West Indies | 4.4 /100 | #236 | Tragic 12.6% |
| Slavs | 3.8 /100 | #237 | Tragic 12.6% |
| Yugoslavians | 3.7 /100 | #238 | Tragic 12.6% |
| Barbadians | 3.6 /100 | #239 | Tragic 12.6% |
| German Russians | 3.2 /100 | #240 | Tragic 12.6% |
| Japanese | 2.7 /100 | #241 | Tragic 12.6% |
| Canadians | 2.6 /100 | #242 | Tragic 12.6% |
Demographics Similar to Immigrants from Norway by Female Disability
In terms of female disability, the demographic groups most similar to Immigrants from Norway are Ugandan (11.9%, a difference of 0.040%), Central American (11.9%, a difference of 0.060%), Ecuadorian (11.9%, a difference of 0.060%), Kenyan (11.9%, a difference of 0.13%), and Immigrants from Nicaragua (11.9%, a difference of 0.13%).
| Demographics | Rating | Rank | Female Disability |
| Nicaraguans | 95.2 /100 | #130 | Exceptional 11.9% |
| Arabs | 95.1 /100 | #131 | Exceptional 11.9% |
| Immigrants | Syria | 94.6 /100 | #132 | Exceptional 11.9% |
| Kenyans | 94.5 /100 | #133 | Exceptional 11.9% |
| Immigrants | Nicaragua | 94.5 /100 | #134 | Exceptional 11.9% |
| Central Americans | 94.2 /100 | #135 | Exceptional 11.9% |
| Ugandans | 94.0 /100 | #136 | Exceptional 11.9% |
| Immigrants | Norway | 93.8 /100 | #137 | Exceptional 11.9% |
| Ecuadorians | 93.4 /100 | #138 | Exceptional 11.9% |
| Immigrants | Hungary | 92.8 /100 | #139 | Exceptional 11.9% |
| Romanians | 91.6 /100 | #140 | Exceptional 11.9% |
| Immigrants | Ecuador | 91.5 /100 | #141 | Exceptional 11.9% |
| Immigrants | Africa | 90.0 /100 | #142 | Excellent 11.9% |
| Immigrants | Sudan | 89.6 /100 | #143 | Excellent 11.9% |
| Immigrants | Austria | 87.9 /100 | #144 | Excellent 12.0% |