Malaysian vs Cape Verdean Vision Disability
COMPARE
Malaysian
Cape Verdean
Vision Disability
Vision Disability Comparison
Malaysians
Cape Verdeans
2.3%
VISION DISABILITY
0.9/ 100
METRIC RATING
241st/ 347
METRIC RANK
2.4%
VISION DISABILITY
0.0/ 100
METRIC RATING
280th/ 347
METRIC RANK
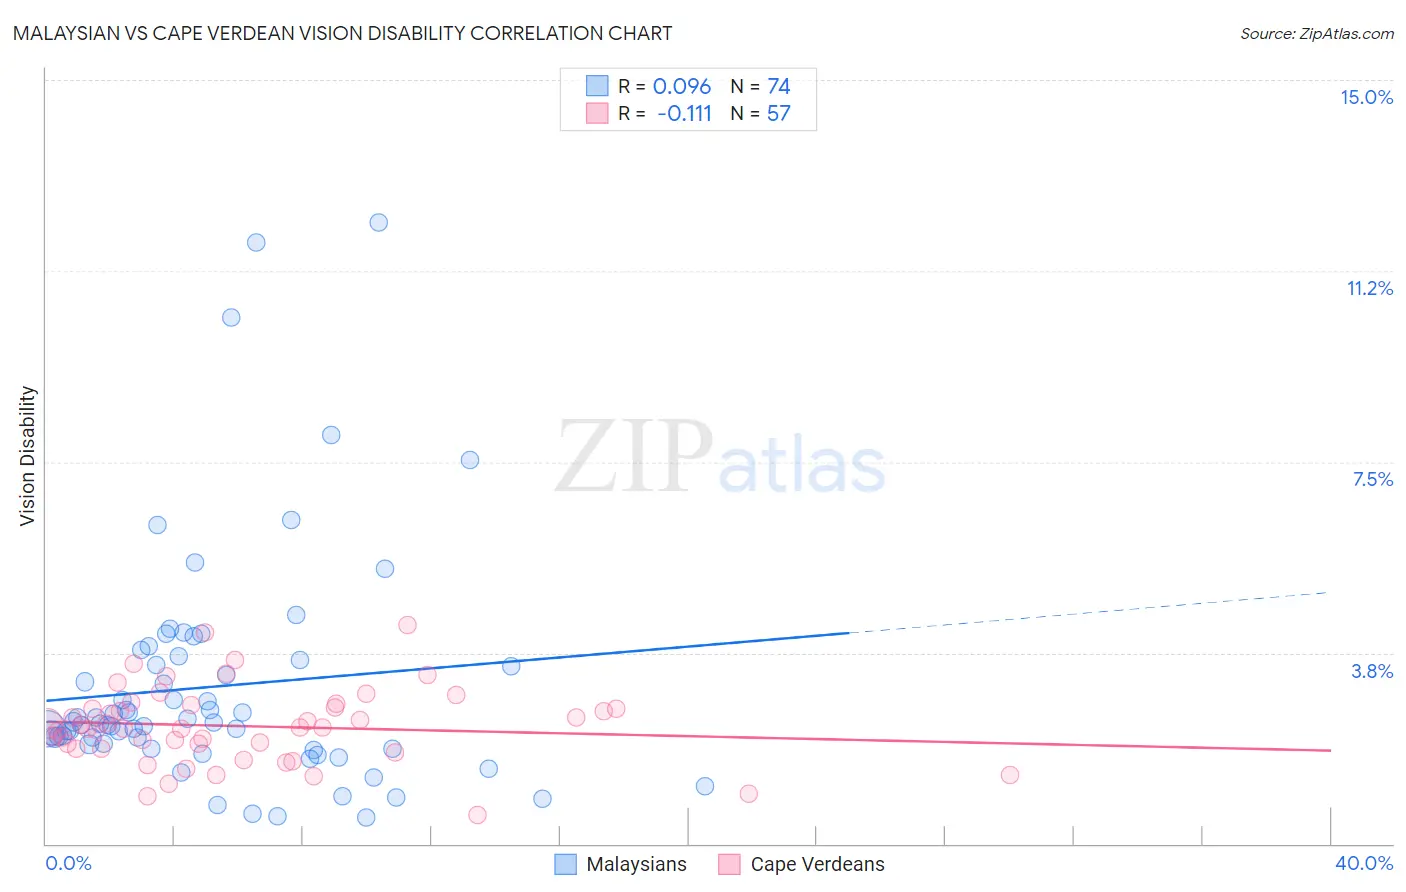
Malaysian vs Cape Verdean Vision Disability Correlation Chart
The statistical analysis conducted on geographies consisting of 226,017,600 people shows a slight positive correlation between the proportion of Malaysians and percentage of population with vision disability in the United States with a correlation coefficient (R) of 0.096 and weighted average of 2.3%. Similarly, the statistical analysis conducted on geographies consisting of 107,539,896 people shows a poor negative correlation between the proportion of Cape Verdeans and percentage of population with vision disability in the United States with a correlation coefficient (R) of -0.111 and weighted average of 2.4%, a difference of 5.2%.
Vision Disability Correlation Summary
| Measurement | Malaysian | Cape Verdean |
| Minimum | 0.52% | 0.56% |
| Maximum | 12.2% | 4.3% |
| Range | 11.7% | 3.7% |
| Mean | 3.1% | 2.3% |
| Median | 2.4% | 2.3% |
| Interquartile 25% (IQ1) | 2.0% | 1.9% |
| Interquartile 75% (IQ3) | 3.6% | 2.7% |
| Interquartile Range (IQR) | 1.6% | 0.84% |
| Standard Deviation (Sample) | 2.3% | 0.75% |
| Standard Deviation (Population) | 2.3% | 0.74% |
Similar Demographics by Vision Disability
Demographics Similar to Malaysians by Vision Disability
In terms of vision disability, the demographic groups most similar to Malaysians are Panamanian (2.3%, a difference of 0.030%), Immigrants from Panama (2.3%, a difference of 0.14%), English (2.3%, a difference of 0.29%), Immigrants from Cambodia (2.3%, a difference of 0.30%), and Immigrants from Portugal (2.3%, a difference of 0.57%).
| Demographics | Rating | Rank | Vision Disability |
| Scottish | 1.6 /100 | #234 | Tragic 2.3% |
| Marshallese | 1.5 /100 | #235 | Tragic 2.3% |
| Immigrants | Congo | 1.4 /100 | #236 | Tragic 2.3% |
| Immigrants | Portugal | 1.4 /100 | #237 | Tragic 2.3% |
| Immigrants | Cambodia | 1.1 /100 | #238 | Tragic 2.3% |
| English | 1.1 /100 | #239 | Tragic 2.3% |
| Panamanians | 0.9 /100 | #240 | Tragic 2.3% |
| Malaysians | 0.9 /100 | #241 | Tragic 2.3% |
| Immigrants | Panama | 0.8 /100 | #242 | Tragic 2.3% |
| Immigrants | Nicaragua | 0.6 /100 | #243 | Tragic 2.3% |
| Immigrants | West Indies | 0.6 /100 | #244 | Tragic 2.3% |
| Alsatians | 0.6 /100 | #245 | Tragic 2.3% |
| French | 0.5 /100 | #246 | Tragic 2.3% |
| Guatemalans | 0.5 /100 | #247 | Tragic 2.3% |
| Sub-Saharan Africans | 0.5 /100 | #248 | Tragic 2.3% |
Demographics Similar to Cape Verdeans by Vision Disability
In terms of vision disability, the demographic groups most similar to Cape Verdeans are Nepalese (2.4%, a difference of 0.040%), Spanish (2.4%, a difference of 0.050%), Bahamian (2.4%, a difference of 0.21%), U.S. Virgin Islander (2.5%, a difference of 0.23%), and Scotch-Irish (2.4%, a difference of 0.25%).
| Demographics | Rating | Rank | Vision Disability |
| Immigrants | Bahamas | 0.1 /100 | #273 | Tragic 2.4% |
| Immigrants | Latin America | 0.0 /100 | #274 | Tragic 2.4% |
| Chippewa | 0.0 /100 | #275 | Tragic 2.4% |
| Scotch-Irish | 0.0 /100 | #276 | Tragic 2.4% |
| Bahamians | 0.0 /100 | #277 | Tragic 2.4% |
| Spanish | 0.0 /100 | #278 | Tragic 2.4% |
| Nepalese | 0.0 /100 | #279 | Tragic 2.4% |
| Cape Verdeans | 0.0 /100 | #280 | Tragic 2.4% |
| U.S. Virgin Islanders | 0.0 /100 | #281 | Tragic 2.5% |
| Immigrants | Caribbean | 0.0 /100 | #282 | Tragic 2.5% |
| Puget Sound Salish | 0.0 /100 | #283 | Tragic 2.5% |
| Yakama | 0.0 /100 | #284 | Tragic 2.5% |
| Immigrants | Central America | 0.0 /100 | #285 | Tragic 2.5% |
| Sioux | 0.0 /100 | #286 | Tragic 2.5% |
| Hondurans | 0.0 /100 | #287 | Tragic 2.5% |