Malaysian vs Scandinavian Vision Disability
COMPARE
Malaysian
Scandinavian
Vision Disability
Vision Disability Comparison
Malaysians
Scandinavians
2.3%
VISION DISABILITY
0.9/ 100
METRIC RATING
241st/ 347
METRIC RANK
2.2%
VISION DISABILITY
50.0/ 100
METRIC RATING
173rd/ 347
METRIC RANK
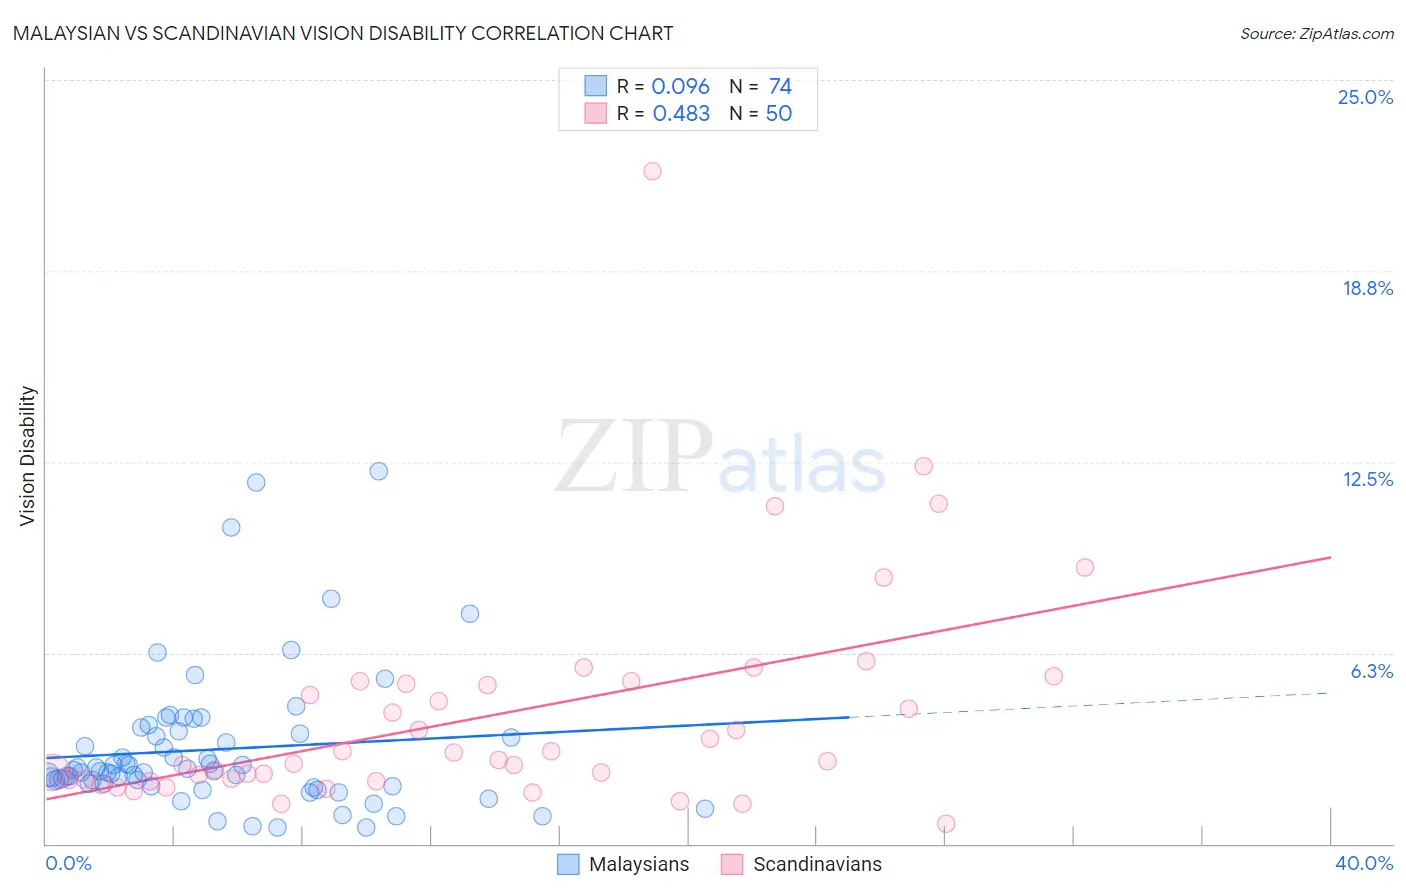
Malaysian vs Scandinavian Vision Disability Correlation Chart
The statistical analysis conducted on geographies consisting of 226,017,600 people shows a slight positive correlation between the proportion of Malaysians and percentage of population with vision disability in the United States with a correlation coefficient (R) of 0.096 and weighted average of 2.3%. Similarly, the statistical analysis conducted on geographies consisting of 471,900,698 people shows a moderate positive correlation between the proportion of Scandinavians and percentage of population with vision disability in the United States with a correlation coefficient (R) of 0.483 and weighted average of 2.2%, a difference of 7.4%.
Vision Disability Correlation Summary
| Measurement | Malaysian | Scandinavian |
| Minimum | 0.52% | 0.66% |
| Maximum | 12.2% | 22.0% |
| Range | 11.7% | 21.3% |
| Mean | 3.1% | 4.2% |
| Median | 2.4% | 2.7% |
| Interquartile 25% (IQ1) | 2.0% | 2.1% |
| Interquartile 75% (IQ3) | 3.6% | 5.2% |
| Interquartile Range (IQR) | 1.6% | 3.1% |
| Standard Deviation (Sample) | 2.3% | 3.7% |
| Standard Deviation (Population) | 2.3% | 3.7% |
Similar Demographics by Vision Disability
Demographics Similar to Malaysians by Vision Disability
In terms of vision disability, the demographic groups most similar to Malaysians are Panamanian (2.3%, a difference of 0.030%), Immigrants from Panama (2.3%, a difference of 0.14%), English (2.3%, a difference of 0.29%), Immigrants from Cambodia (2.3%, a difference of 0.30%), and Immigrants from Portugal (2.3%, a difference of 0.57%).
| Demographics | Rating | Rank | Vision Disability |
| Scottish | 1.6 /100 | #234 | Tragic 2.3% |
| Marshallese | 1.5 /100 | #235 | Tragic 2.3% |
| Immigrants | Congo | 1.4 /100 | #236 | Tragic 2.3% |
| Immigrants | Portugal | 1.4 /100 | #237 | Tragic 2.3% |
| Immigrants | Cambodia | 1.1 /100 | #238 | Tragic 2.3% |
| English | 1.1 /100 | #239 | Tragic 2.3% |
| Panamanians | 0.9 /100 | #240 | Tragic 2.3% |
| Malaysians | 0.9 /100 | #241 | Tragic 2.3% |
| Immigrants | Panama | 0.8 /100 | #242 | Tragic 2.3% |
| Immigrants | Nicaragua | 0.6 /100 | #243 | Tragic 2.3% |
| Immigrants | West Indies | 0.6 /100 | #244 | Tragic 2.3% |
| Alsatians | 0.6 /100 | #245 | Tragic 2.3% |
| French | 0.5 /100 | #246 | Tragic 2.3% |
| Guatemalans | 0.5 /100 | #247 | Tragic 2.3% |
| Sub-Saharan Africans | 0.5 /100 | #248 | Tragic 2.3% |
Demographics Similar to Scandinavians by Vision Disability
In terms of vision disability, the demographic groups most similar to Scandinavians are Northern European (2.2%, a difference of 0.0%), Immigrants from Canada (2.2%, a difference of 0.0%), Immigrants from Fiji (2.2%, a difference of 0.15%), Yugoslavian (2.2%, a difference of 0.22%), and Slavic (2.2%, a difference of 0.26%).
| Demographics | Rating | Rank | Vision Disability |
| Immigrants | England | 62.8 /100 | #166 | Good 2.1% |
| Immigrants | Africa | 62.6 /100 | #167 | Good 2.1% |
| Brazilians | 62.2 /100 | #168 | Good 2.1% |
| South American Indians | 57.4 /100 | #169 | Average 2.2% |
| Swiss | 55.7 /100 | #170 | Average 2.2% |
| Lebanese | 54.3 /100 | #171 | Average 2.2% |
| Northern Europeans | 50.1 /100 | #172 | Average 2.2% |
| Scandinavians | 50.0 /100 | #173 | Average 2.2% |
| Immigrants | Canada | 50.0 /100 | #174 | Average 2.2% |
| Immigrants | Fiji | 47.6 /100 | #175 | Average 2.2% |
| Yugoslavians | 46.5 /100 | #176 | Average 2.2% |
| Slavs | 46.0 /100 | #177 | Average 2.2% |
| Immigrants | Oceania | 45.1 /100 | #178 | Average 2.2% |
| Immigrants | North America | 44.5 /100 | #179 | Average 2.2% |
| Uruguayans | 42.7 /100 | #180 | Average 2.2% |