Malaysian vs Dominican Vision Disability
COMPARE
Malaysian
Dominican
Vision Disability
Vision Disability Comparison
Malaysians
Dominicans
2.3%
VISION DISABILITY
0.9/ 100
METRIC RATING
241st/ 347
METRIC RANK
2.6%
VISION DISABILITY
0.0/ 100
METRIC RATING
311th/ 347
METRIC RANK
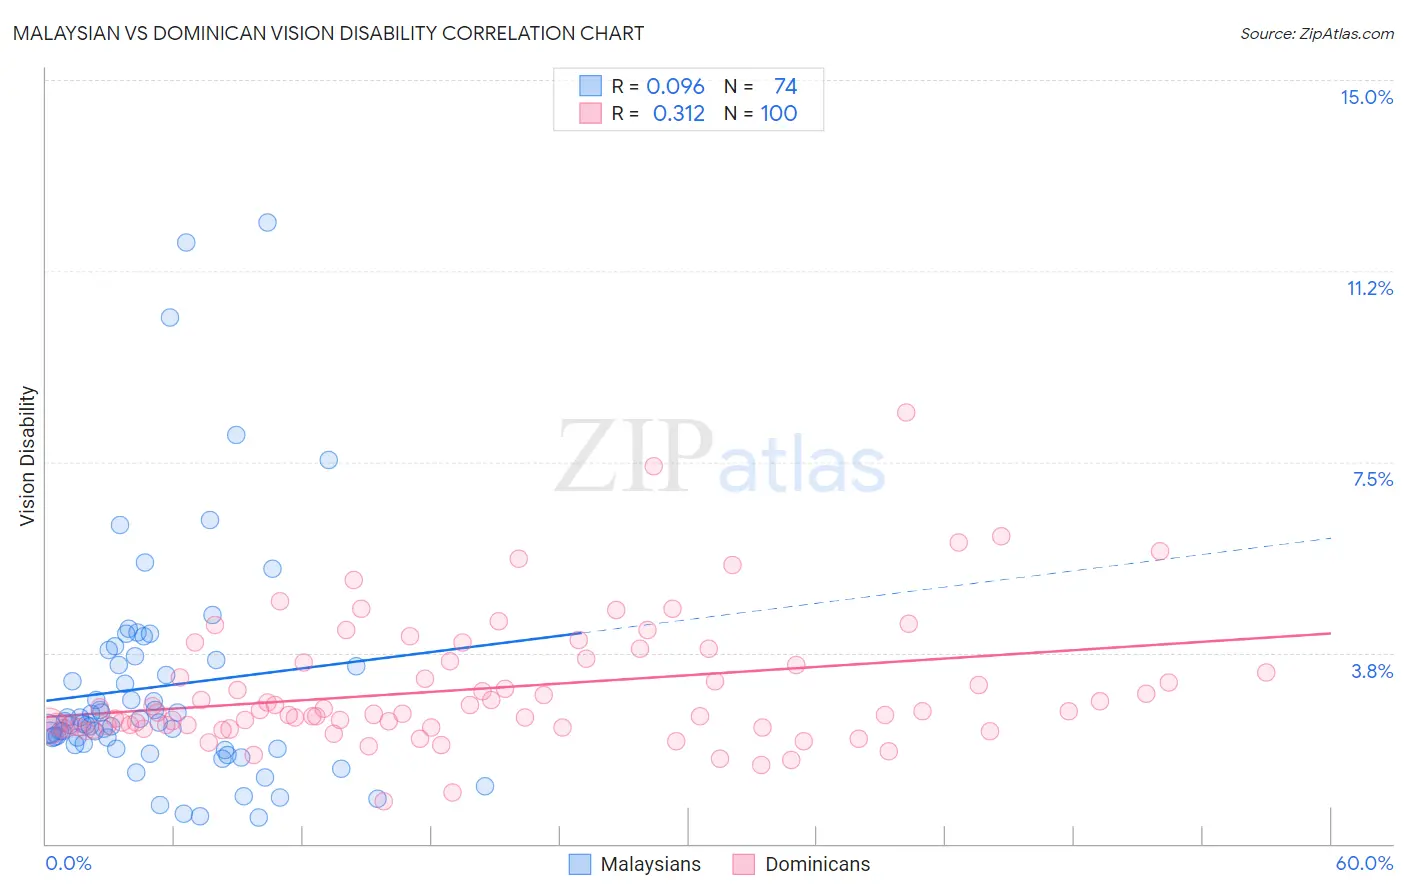
Malaysian vs Dominican Vision Disability Correlation Chart
The statistical analysis conducted on geographies consisting of 226,017,600 people shows a slight positive correlation between the proportion of Malaysians and percentage of population with vision disability in the United States with a correlation coefficient (R) of 0.096 and weighted average of 2.3%. Similarly, the statistical analysis conducted on geographies consisting of 354,764,822 people shows a mild positive correlation between the proportion of Dominicans and percentage of population with vision disability in the United States with a correlation coefficient (R) of 0.312 and weighted average of 2.6%, a difference of 12.9%.
Vision Disability Correlation Summary
| Measurement | Malaysian | Dominican |
| Minimum | 0.52% | 0.84% |
| Maximum | 12.2% | 8.5% |
| Range | 11.7% | 7.6% |
| Mean | 3.1% | 3.0% |
| Median | 2.4% | 2.6% |
| Interquartile 25% (IQ1) | 2.0% | 2.3% |
| Interquartile 75% (IQ3) | 3.6% | 3.6% |
| Interquartile Range (IQR) | 1.6% | 1.3% |
| Standard Deviation (Sample) | 2.3% | 1.3% |
| Standard Deviation (Population) | 2.3% | 1.3% |
Similar Demographics by Vision Disability
Demographics Similar to Malaysians by Vision Disability
In terms of vision disability, the demographic groups most similar to Malaysians are Panamanian (2.3%, a difference of 0.030%), Immigrants from Panama (2.3%, a difference of 0.14%), English (2.3%, a difference of 0.29%), Immigrants from Cambodia (2.3%, a difference of 0.30%), and Immigrants from Portugal (2.3%, a difference of 0.57%).
| Demographics | Rating | Rank | Vision Disability |
| Scottish | 1.6 /100 | #234 | Tragic 2.3% |
| Marshallese | 1.5 /100 | #235 | Tragic 2.3% |
| Immigrants | Congo | 1.4 /100 | #236 | Tragic 2.3% |
| Immigrants | Portugal | 1.4 /100 | #237 | Tragic 2.3% |
| Immigrants | Cambodia | 1.1 /100 | #238 | Tragic 2.3% |
| English | 1.1 /100 | #239 | Tragic 2.3% |
| Panamanians | 0.9 /100 | #240 | Tragic 2.3% |
| Malaysians | 0.9 /100 | #241 | Tragic 2.3% |
| Immigrants | Panama | 0.8 /100 | #242 | Tragic 2.3% |
| Immigrants | Nicaragua | 0.6 /100 | #243 | Tragic 2.3% |
| Immigrants | West Indies | 0.6 /100 | #244 | Tragic 2.3% |
| Alsatians | 0.6 /100 | #245 | Tragic 2.3% |
| French | 0.5 /100 | #246 | Tragic 2.3% |
| Guatemalans | 0.5 /100 | #247 | Tragic 2.3% |
| Sub-Saharan Africans | 0.5 /100 | #248 | Tragic 2.3% |
Demographics Similar to Dominicans by Vision Disability
In terms of vision disability, the demographic groups most similar to Dominicans are Blackfeet (2.6%, a difference of 0.040%), Immigrants from Yemen (2.6%, a difference of 0.37%), Arapaho (2.6%, a difference of 0.65%), Immigrants from Dominican Republic (2.6%, a difference of 0.67%), and Iroquois (2.6%, a difference of 0.70%).
| Demographics | Rating | Rank | Vision Disability |
| Aleuts | 0.0 /100 | #304 | Tragic 2.6% |
| Hispanics or Latinos | 0.0 /100 | #305 | Tragic 2.6% |
| Iroquois | 0.0 /100 | #306 | Tragic 2.6% |
| Immigrants | Dominican Republic | 0.0 /100 | #307 | Tragic 2.6% |
| Arapaho | 0.0 /100 | #308 | Tragic 2.6% |
| Immigrants | Yemen | 0.0 /100 | #309 | Tragic 2.6% |
| Blackfeet | 0.0 /100 | #310 | Tragic 2.6% |
| Dominicans | 0.0 /100 | #311 | Tragic 2.6% |
| Americans | 0.0 /100 | #312 | Tragic 2.6% |
| Potawatomi | 0.0 /100 | #313 | Tragic 2.6% |
| Inupiat | 0.0 /100 | #314 | Tragic 2.7% |
| Osage | 0.0 /100 | #315 | Tragic 2.7% |
| Shoshone | 0.0 /100 | #316 | Tragic 2.7% |
| Yup'ik | 0.0 /100 | #317 | Tragic 2.7% |
| Alaska Natives | 0.0 /100 | #318 | Tragic 2.7% |